
User`s guide
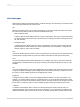
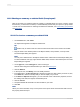

Funnel
Funnel charts are often used to represent stages in a sales process. For example, the amount of
potential revenue shown for each stage. This type of chart can also be useful in identifying potential
problem areas in an organization's sales processes. A funnel chart is similar to a stacked bar chart in
that it represents 100% of the summary values for the groups included in the chart.
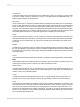
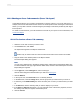
Histogram
A histogram is a type of bar chart used to depict how measurements vary from the mean value. It can
help to identify the cause of problems in a process by the shape of the distribution as well as the width
(deviation) of the distribution. In a histogram, the frequency is represented by the area of a bar rather
than the height of the bar.
12.1.4 Where to place a chart
The placement of a chart determines which data is displayed and where it is printed. For example, a
chart placed in the Report Header section includes the data for the entire report, while a chart that is
placed in a Group Header or in a Group Footer section displays only the group specific data.
Note:
• If your report contains subreports, you can place charts in those subreports as well. See Subreports.
• By default, when you insert a chart or chart object frame, it is placed in the Report Header.
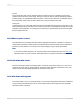
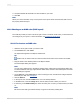
12.1.5 Drill-down with charts
Not only is charting a means of presenting data—it is also an analysis tool. Move your cursor over a
section of the group chart on the Preview tab, so that the pointer becomes a Drill-down cursor, then
double-click to view the underlying details for that section of the chart.
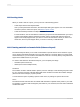
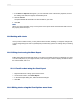
12.1.6 Drill-down with legends
If the chart consists of one or more group fields, you can use the chart legend to drill down on individual
groups. Double-click the drill-down cursor on the markers and text in the legend to view the details
about that section of the chart.
2012-03-14273
Charting