
User`s guide
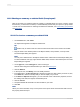

3-D Surface
3-D Surface charts present a topographic view of multiple sets of data. If, for example, you need a chart
to show the number of sales by customer by country, in a visually dynamic and relational format, you
might consider using the 3-D Surface chart.
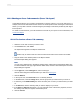
XY Scatter
An XY Scatter chart is a collective of plotted points that represent specific data in a pool of information.
The XY Scatter chart allows the user to consider a larger scope of data for the purpose of determining
trends. For example, if you input customer information, including sales, products, countries, months,
and years, you would have a collective of plotted points that represents the pool of customer information.
Viewing all of this data on an XY Scatter chart would allow you to speculate as to why certain products
were selling better than others or why certain regions were purchasing more than others.
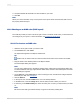
Radar
A radar chart positions group data, such as countries or customers, at the perimeter of the radar. The
radar chart then places numeric values, increasing in value, from the center of the radar to the perimeter.
In this way, the user can determine, at a glance, how specific group data relates to the whole of the
group data.
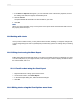
Bubble
A bubble chart (an extension of the XY Scatter chart type) displays data as a series of bubbles, where
the size of the bubble is proportional to the amount of data. A bubble chart would be very effective with
the number of products sold in a certain region; the larger the bubble, the greater the number of products
sold in that region.
Stock
A stock chart presents high and low values for data. It is useful for monitoring financial or sales activities.
Note:
Crystal Reports offers two possible formats for stock charts: High-Low and High-Low-Open-Close. Each
of these types requires a series of values in the order specified in its name.
Numeric Axis
A numeric axis chart is a bar, line, or area chart that uses a numeric field or a date/time field as its "On
change of" field. Numeric axis charts provide a way of scaling your X-axis values, thus creating a true
numeric X-axis or a true date/time X-axis.
Gauge
A gauge chart presents values graphically as points on a gauge. Gauge charts, like pie charts, are
typically used for one group of data (for example, the percentage of sales for the entire inventory).
Gantt
A Gantt chart is a horizontal bar chart often used to provide a graphical illustration of a schedule. The
horizontal axis shows a time span, while the vertical axis shows a series of tasks or events. Horizontal
bars on the chart represent event sequences and time spans for each item on the vertical axis. You
should use only date fields when creating a Gantt chart. The field you choose for the data axis should
be set to "For Each Record," and the start and end-date fields should be added to the "Show value(s)"
area of the Chart Expert's Data tab.
2012-03-14272
Charting