
User`s guide

12.1.3 Chart types
Different sets of data are particularly suited to a certain chart type. The following is an overview of the
main chart types and their most common uses.
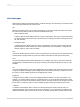
Bar
Most bar charts (also known as a column chart) display or compare several sets of data. Two useful
bar charts are the Side-by-Side bar chart and the Stacked bar chart.
• Side-by-Side bar chart
A Side-by-Side bar chart displays data as a series of vertical bars. This type of chart is best suited
for showing data for several sets over a period of time (for example, last year's sales figures for AZ,
CA, OR, and WA).
• Stacked bar chart
A Stacked bar chart displays data as a series of vertical bars. This type of chart is best suited for
representing three series of data, each series represented by a color stacked in a single bar (for
example, sales for 1997, 1998, and 1999).
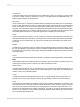
Line
A line chart displays data as a series of points connected by a line. This type of chart is best suited for
showing data for a large number of groups (for example, total sales over the past several years).
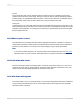
Area
An area chart displays data as areas filled with color or patterns. This type of chart is best suited for
showing data for a limited number of groups (for example, percentage of total sales for AZ, CA, OR,
and WA).
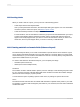
Pie
A pie chart displays data as a pie, split and filled with color or patterns. Pie charts are typically used for
one group of data (for example, the percentage of sales for the entire inventory); however, you have
the option to choose multiple pie charts for multiple groups of data.
Doughnut
A doughnut chart is similar to a pie chart, displaying data as sections of a circle or doughnut. If, for
example, you charted sales by region on a particular report, you would see the total number of sales
(the figure) in the center of the doughnut and the regions as colored sections of the doughnut. As with
the pie chart, you have the option to choose multiple doughnut charts for multiple groups of data.
3-D Riser
A 3-D Riser chart displays data in a series of 3-dimensional objects, lined up side-by-side, in a
3-dimensional plane. The 3-D Riser chart shows the extremes in your report data. For example, the
differences between sales by customer by country are visually dynamic when presented in this chart.
2012-03-14271
Charting