
User`s guide


• OLAP data.
You will typically chart on summary and subtotal information at the group level. However, depending
on the type of data you are working with, you can create an Advanced, Cross-Tab, or OLAP grid chart
for your report.
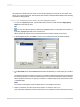
12.1.2 Chart layouts
The Chart Expert provides four layouts that correspond to certain sets of data.
You can create charts with any of the following layouts, and depending on the data you are using, you
can change the chart from one layout to another.
Advanced
Use the Advanced layout when you have multiple chart values or when you do not have any group or
summary fields in the report.
The Advanced chart layout supports one or two condition fields: with these condition fields, you can
create a 2-D, 3-D, or pie chart. Other specific functions with the Advanced layout include:
• Values can be grouped in ascending, descending, or specified order, as well as by Top N or Sort
totals.
• Values can be plotted for each record.
• Values can be plotted as a grand total for all records.
• Charts can be based on formula and Running Total fields.
Group
The Group layout is a simplified layout in which you show a summary on change of field for topics such
as Country.
Note:
In order to create a chart using the Group layout, you must have at least one group and at least one
summary field for that group.
Cross-Tab
Use the Cross-Tab layout to chart on a Cross-Tab object. A Cross-Tab chart uses the fields in the
cross-tab for its condition and summary fields.
OLAP
Use the OLAP layout to chart on an OLAP grid. An OLAP chart uses the fields in the OLAP grid for its
condition and summary fields.
Note:
Your report must include an OLAP grid before you can create an OLAP chart.
2012-03-14270
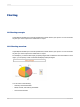
Charting