
User`s guide


Charting
12.1 Charting concepts
Crystal Reports enables you to include sophisticated, colorful charts in your reports. You can use charts
any time you want to improve the usefulness of a report.
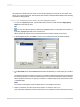
12.1.1 Charting overview
Crystal Reports enables you to include sophisticated, colorful charts in your reports. You can use charts
any time you want to improve the usefulness of a report.
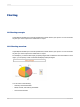
For example, if you have a sales report grouped by Region with a subtotal of Last Year's Sales for each
region, you can quickly create a chart that will display Sales per Region.
You can chart on the following:
• Summary and subtotal fields.
• Detail, formula, and Running Total fields.
• Cross-Tab summaries.
2012-03-14269
Charting