
User`s guide

With top N groups, you are instructing the program to display those groups that have the highest
summary values (Top N).
•
• With bottom N groups, you are instructing the program to display those groups that have the
lowest summary values (Bottom N).
2.
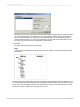
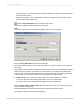
Click the Group Sort Expert button on Expert Tools toolbar.
The Group Sort Expert appears with a tab for your group.
Note:
If you have multiple groups, the program will display a tab for each of the groups.
3.
Choose Top N or Bottom N from the first drop-down list.
4.
Choose the summary that you want to base your selection on from the "based on" drop-down list
on the right.
The "based on" drop-down list on the right is for those cases in which you have multiple summaries
within a single group section. For example, in an orders report, you might sum and average the
orders for each customer and then display both the sum and the average in the same group section.
In such a case, you would select the sum or the average from this drop-down list.
5.
In the Where N is text box, enter the number of groups you want to display. For example:
• To report on the three fastest selling product lines, set N to be equal to three.
• To report on the five least productive sales regions, set N to be equal to five.
6.
Click the Include Others, with the name check box and enter a name if you want to group all the
other records into a single group.
7.
Select Include ties to accommodate groups whose summarized values are equal.
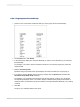
For example, suppose you had the following groups:
2012-03-14169
Sorting, Grouping, and Totaling