
User`s guide

2.
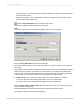
Click the tab for the group you want to sort.
3.
Select the All option from the drop-down list on the left.
4.
Choose the summary that you want to base your selection on from the "based on" drop-down list
on the right.
The "based on" drop-down list on the right is for those cases in which you have multiple summaries
within a single group section. For example, in an orders report, you might sum and average the
orders for each customer and then display both the sum and the average in the same group section.
In such a case, you would select the sum or the average from this drop-down list.
5.
Specify the sort direction.
6.
To select a second group sort, repeat Steps 2-5.
When you run the report, the program will order the groups based on the summary value(s) specified.
8.3.3 Selecting top or bottom N groups or percentages
At times, you might want to show only the top or bottom groups or percentage values in a report: the
fastest selling product lines, the countries that account for the top 25 percent of sales, the states that
generate the most orders, and so on. Because this kind of selection is so popular, the program includes
the Group Sort Expert for setting it up easily.
There is one other element to consider when setting up top N: what to do with all the records from other
groups that do not fit the top N or bottom N criteria you have set. You need to decide whether to eliminate
those records from your report entirely or to lump them all together into a single group. The program
enables you to choose either option.
Note:
• A report must contain a summary value in order to be able to perform a top N or bottom N selection.
See Summarizing grouped data.
• It is recommended that you do not use a group that is sorted hierarchically in a top or bottom N
selection. The integrity of your hierarchical group sort might be affected by the top or bottom N
selection.
8.3.3.1 To select the top or bottom N groups
Note:
This procedure shows you how to select top or bottom N groups. Top or bottom percentages work the
same way except that you define the percentage value instead of the number of groups.
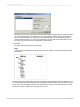
1.
Create a report and summarize the data as desired. When you summarize the data, the program
breaks the data into groups and summarizes each group.
2012-03-14168
Sorting, Grouping, and Totaling