
User`s guide

3.
Click Options.
4.
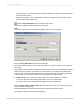
In the Change Group Options dialog box, edit the group as necessary.
5.
Click OK to close the Change Group Options dialog box and again to close the Group Expert dialog
box.
The report reflects the changes you have made to the group.
8.3 Summarizing grouped data
One of the primary purposes for breaking data into groups is to run calculations on each group of records
instead of on all the records in the report.
When the program summarizes data, it sorts the data, breaks it into groups, and then summarizes the
values in each group. It does this all automatically.
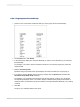
The program includes a number of summarizing options. Depending on the data type of the field you
plan to summarize, you can:
• Sum the values in each group.
• Count all the values or only those values that are distinct from one another.
• Determine the maximum, minimum, average, or Nth largest value.
• Calculate up to two kinds of standard deviations and variances.
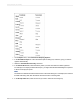
For example:
• Customer list reports: determine the number of customers in each state. The summary would count
the distinct customers in each state group.
• Order reports: determine the average order placed each month. The summary would calculate the
size of the average order for each month group.
• Sales reports: determine the total sales per sales representative. The summary would sum or subtotal
the order amounts for each sales representative group.
Note:
You can also calculate summary fields across hierarchical groupings. To do so, select "Summarize
across hierarchy" in the Insert Summary dialog box.
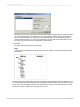
8.3.1 To summarize grouped data
1.
On the Insert menu, click Summary.
2012-03-14166
Sorting, Grouping, and Totaling