
Specifications


Time
Magnitude
Frequency
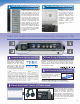
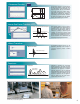
Hammering measurement with the CF-7200, GK-3100 Impulse
Hammer and an NP Series Acceleration pickup
Analysis of micro-object using a LV Series Laser Doppler Vibration
Meter and an electromagnetic shaker
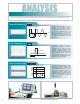
ANALYSIS
Time-axis Waveform
Time-axis waveform
Performs A/D conversion of the raw
waveform of an electrical signal of
vibration, noise, pressure, strain, etc.
coming from a sensor and then displays
the result as time-domain data. The X-
and Y-axis values at any point can
directly be read using the search cursor.
The delta cursor function makes it easier
to read the time difference and level
difference.
Power Spectrum
Power spectrum
The power spectrum indicates the
magnitude of frequency components
contained in a sampled time-axis
waveform. Frequency analysis enables
detection of abnormal conditions of a
facility, which are difficult to estimate
through measurement of vibration and
noise level and observation of raw time-
axis waveform. The natural frequency of a
structure can also be measured.
Frequency Response Function
Frequency response function
The frequency response function indicates
the ratio of output to input and the frequency
characteristics of phase difference. The
resonant frequency and phase of a structure
can easily be obtained accurately by
entering the signal of vibration force
generated to Ch1 by an impulse hammer or
shaker and then inputting the response
(signal of acceleration, velocity and
displacement) to Ch2.
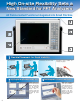
New Possibilities for Measurement and Analysis, from Laboratories to Production Sites
7