
User's Manual

EMS User Manual-v2.0.0
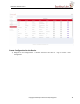
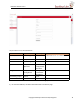
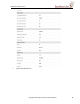
3) It is possible to monitor real time values for different statistics graphically. Please select the
value(s) to be plotted and then the values appear along with their plot in the area for the plot.
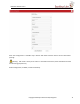
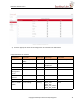
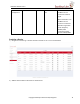
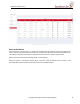
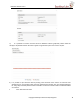
4) It is possible to plot historical data by clicking “Plot Historical Chart” button. A historical chart
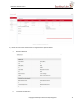
window pops up. It is possible to plot using user selected time intervals. Also, pre-configured buttons
for 1day, 7day and 15day historical data is available. The historical statistics data can be downloaded
as a CSV file.
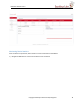
a Click “Plot Historical Chart”
Copyright Saankhya Labs Private Ltd, Bangalore 19