
User's Manual


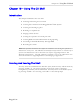

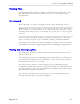


Table Of Contents
- About this User Guide
- Table Of Contents
- Chapter 1– Setting Up And Administering The Switch
- Chapter 2 - Configuring MAC Address Management
- Chapter 3 – Configuring the Ports
- Chapter 4 – Configuring VLANs
- Chapter 5 – Configuring Class of Service
- Chapter 6 – Configuring Rapid Spanning Tree
- Chapter 7 – Configuring Multicast Filtering
- Chapter 8 – Diagnostics
- Chapter 9 – Using Ethernet And RMON Statistics
- Introduction
- View Ethernet Statistics
- View Ethernet Port Statistics
- Remote Monitoring (RMON)
- RMON Historical Statistics Concepts And Issues
- RMON Alarms And Events Concepts And Issues
- The Alarm Process
- Alarm Generation And Hysteresis
- Delta vs. Absolute Values
- Configure RMON Alarms
- Configure RMON Events
- RMON Event Logs
- Troubleshooting
- Chapter 10 - Using The CLI Shell
- Chapter 11 – Upgrading Firmware And Managing Configurations
- Appendix A - Menu Tree
- Appendix B - SNMP MIB Support
- Appendix C – SNMP Trap Summary
- Appendix D – RMON Acceptable MIB Parameters
- Index

RuggedSwitch™ User Guide
Tracing Events
The CLI trace command provides a means to trace the operation of various
protocols. The trace provides detailed information including RSTP packet
decodes, IGMP activity and MAC address displays.
Notes:
Tracing has been designed to provide detailed information to expert users.
Note that all tracing is disabled upon switch startup.
In order to display the current trace settings and discover the systems that be
traced, enter the CLI command “trace ?”.
Figure 63: Displaying Trace settings
Enabling Tracing
Tracing can be enabled on a per subsystem basis. Obtain detailed information
about individual subsystems by entering “trace subsystem_name ?<CR>”. Some
subsystems offer a mechanism to enable tracing only on certain ports.
Figure 64: Changing Trace settings
>trace ?
Supported commands:
noclear Starts the log without clearing it first
alloff Disables all trace subsystems from tracing
allon Enables all flags in all trace subsystems
stp Traces STP operations
link Displays switch fabric statistics
mac Displays MAC Events
forward Forwards trace messages to an IP:UDP address
ip Traces IP communications
igmp Displays IGMP Snooping events
Enter "trace command ?" for more information on a particular command.
STP : Logging is disabled
LINK : Logging is disabled
MAC : Logging is disabled
FORW : IP: 0.0.0.0 UDP: 0 (OFF)
IP : Logging is disabled
IGMP : Logging is disabled
>trace stp ?
trace stp syntax:
stp [-|+] [all] [verbose] [packets] [timers] [actions]
[decodes] [ports[port_number|all]]
STP : Logging is disabled
>trace stp all
STP : Logging all conditions on port(s) 1-16
>trace link ?
trace link syntax
link changes | stats | allon | alloff | statsonce
LINK : Logging is disabled
>trace link changes
LINK : changes
RuggedCom