
User manual


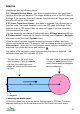

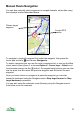

Route Graphs
For routes you can plot altitude on the y-axis against
distance on the x-axis. Waypoints are shown as
dotted vertical lines. If a way point is currently
selected it is shown as a solid vertical line.
If the map centre is within 300m of the route then the
closest point on the route is shown as a red line – for
example, if the map view is locked to the GPS the red
line will indicate the closest point on the route. Equally
you can use the map's select cursor.
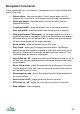
As for tracks zoom in with the up cursor pad or *, and
zoom out with the down cursor pad or #. Scroll left
and right with the left and right cursor pad. On touch
phones use the buttons.
On touch phones zoom in and out with the zoom
buttons. Scroll left and right with the left and right
buttons.
Tracks have an additional down button to step
through the different graphs.
61