
User manual

Graphs
The graph allows you to see a plot of speed,
distance, altitude and GPS altitude against time for a
track. For a route you can see altitude plotted
against distance.
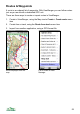
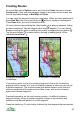
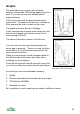
In this first screen grab the graph shows speed
against time. The speed in km per hour is shown on
the y-axis and the time is shown on the x-axis.
The speed units used are set in Settings.
In this case the time is shown is the actual time, but
this can be changed to be relative to start of the
track starting from 0:00.
The name of the track is shown in the title bar.
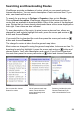
You can zoom into the graph by pressing the up
cursor pad or pressing *. Zoom out using the down
cursor pad or #. On touch screen phones use the
zoom in and out buttons.
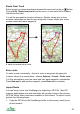
When you are zoomed in small triangles appear to
the left and right of the bottom axis, their colour
indicating the scroll position.
Scroll left and right with the left and right cursor pad,
or on touch screen phones the left and right buttons.
Zoomed in, note scroll arrows
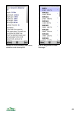
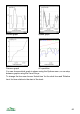
For tracks you can choose between showing:
1. Speed
2. Altitude (calculated from the data with your maps)
3. GPS Altitude (WGS84)
4. Distance from start
All 4 quantities, in which case they are shown in different colours.
59