
Brochure


12
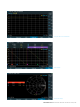
Modulation analysis
The R&S®ZPH-K7 option converts the R&S®Cable Rider ZPH
into a modulation analyzer to measure the quality of ampli-
tude or frequency modulated signals. The analog modula-
tion display shows the waveform as well as measurement
parameters such as carrier power, carrier offset, modula-
tion index (depth) for AM signals, frequency deviation for
FM signals, SINAD and THD. The modulation summary
display provides user-definable limits for each measure-
ment. This feature is especially useful for installation and
maintenance of AM/FM radio stations.
Basic digital modulation formats are used in many ap-
plications, e.g. near-field communications. The R&S®ZPH
supports both ASK and FSK analysis. The digital modula-
tion displays include trace, eye diagram, modulation error
and symbol analysis. Specialized configuration presets
for Bluetooth® Low Energy (Bluetooth® LE) and tire pres-
sure monitoring systems (TPMS) are available, too. The
R&S®ZPH-K7 option lets users easily verify the quality of
the basic modulated signals
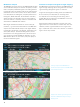
Display of the interferer signal strength on the
map with the R&S®ZPH-K16 signal strength
mapping option
Interference analysis and signal strength mapping
The R&S®ZPH-K15 interference analysis and R&S®ZPH-K16
signal strength mapping options are great tools for analyz-
ing and locating ambiguous signals or interferers.
Long-term spectrogram recording allows up to 999 hours
of on-air activity to be captured; the recording dura-
tion depends on the recording interval setting. The re-
corded data can be analyzed on the R&S®ZPH or with the
R&S®InstrumentView software.
Signal strength mapping displays a pictorial view of the
signal power level on an indoor or outdoor map. The color
indicator provides a good estimation of the signal cover-
age in a particular area or where the interferer or intended
signal is most likely located.
Locating a signal with the R&S®ZPH-K15
interference analysis option and the R&S®HE400
series directional antenna