
User Manual

Digital Demodulation
R&S
®
FPC
155User Manual 1178.4130.02 ─ 05
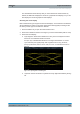
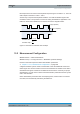
● "Modulation Error": Shows the modulation error over time (% for ASK and Hz
for FSK). The modulation error shows the deviation of the measured symbols
from the ideal symbol locations. The ideal symbol locations are defined in a ref-
erence signal.
Figure 15-6: Modulation error of a 2FSK signal
Numerical results
The diagram header contains various numerical results of the modulated and unmodu-
lated signals.
●
Frequency Deviation (FSK)
Shows the frequency deviation between measured signal and reference signal.
●
Carrier Frequency Drift (FSK)
Shows the drift in the carrier frequency of the measured signal.
●
Magnitude Error (FSK)
Shows the difference between the measured magnitude and the magnitude of the
reference signal.
●
Modulation Index (ASK)
Shows the modulation index of the measured signal.
●
Modulation Depth (ASK)
Shows the modulation depth of the measured signal.
●
Modulation Error
Shows the modulation deviation between measured signal and reference signal.
●
Carrier Power
Shows the power of the measured carrier signal.
●
Carrier Frequency Error
Shows the mean carrier frequency offset in Hz.
Modulation depth and modulation index
The modulation depth indicates the amplitude drop during low state amplitudes (binary
1 = high state or modulated signal, binary 0 = low state or unmodulated signal). The
high state amplitude is normalized to 100 % (top of the diagram by default). The modu-
Measurements and Result Displays