
User Manual

Analog Demodulation
R&S
®
FPC
142User Manual 1178.4130.02 ─ 05
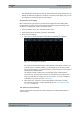
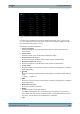
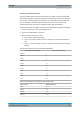
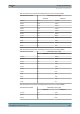
Figure 14-2: Numerical results for an AM signal, including limit evaluation
For each aspect, the R&S FPC shows the measured "Result", and, if you are using
limits, the "Upper Limit" and "Lower Limit" value you have defined, including the "Sta-
tus" of the limit check ("Pass" or "Fail").
The following results are evaluated:
●
Carrier Freq Offset
Shows the deviation of the calculated carrier frequency to the ideal carrier fre-
quency in Hz.
●
Carrier Power
Shows the power of the carrier without modulation in dBm.
●
Freq Deviation (FM domain)
Shows the frequency deviation that the carrier signal is modulated with.
●
Modulation Depth (AM domain)
●
Shows the difference in amplitude the carrier signal is modulated with.
●
+Peak / -Peak
Shows the minimum and maximum frequency deviation (FM signals) or modulation
depth (AM signals).
●
±Peak/2
Shows the average frequency deviation (FM signals) or modulation depth (AM sig-
nals).
(| +Peak | + | -Peak |) / 2
●
RMS
Shows the root mean square of the frequency deviation (FM signals) or modulation
depth (AM signals).
●
Modulation Frequency
Shows the modulation frequency.
●
SINAD
Shows the signal-to-noise-and-distortion
The SINAD measures the ratio of the total power to the power of noise and har-
monic distortions. The noise and harmonic power is calculated inside the AF spec-
trum span. The DC offset is removed before the calculation.
●
THD
Measurements and Result Displays