
User Manual

The Receiver Application
R&S
®
FPC
129User Manual 1178.4130.02 ─ 05
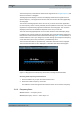
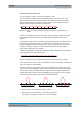
The fixed frequency measurement measures the signal level of a single frequency and
shows the results in a bargraph.
The bargraph result display is a basic result display that shows the signal level at a
specific frequency. The signal level is shown both as a numeric value and graphically
as a bargraph.
The results in the bargraph are shown as soon as you enter the receiver application
(for the frequency that is currently selected) and are updated continuously. The current
signal level is represented by light blue vertical lines in the bargraph. The unit of the
displayed power level is variable and depends on the unit you have set.
The scale of the bargraph depends on the current reference level and display range.
In addition to the current signal level, the bargraph also shows the highest signal level
that has been measured since the measurement has begun (Max Hold information). It
remains effective, even if you change any receiver settings (for example the frequency
or the attenuation) and is only reset when you deliberately do so.
The max hold information is represented by a dark blue vertical line in the bargraph.
The max hold information is also displayed in a dark blue font above the bargraph.
Figure 13-1: Bargraph of the fixed frequency measurement, including maxhold information
Selecting fixed frequency measurements
1. Press the "Meas" key to open the measurement menu.
2. Select the "Fixed Frequency" menu item.
The R&S FPC shows the signal level measured at the current receiver frequency.
13.1.2 Frequency Scan
Access: "Meas" > "Frequency Scan"
Access (trace style): "Trace" > "Trace Style: <x>"
Measurements and Result Displays