
User Manual

The Spectrum Application
R&S
®
FPC
111User Manual 1178.4130.02 ─ 05
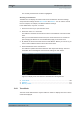
If you have selected the average trace mode ("Average" menu item), the R&S FPC
opens an input field to define the number of measurements included in the averag-
ing ("Average Count").
4. Enter the number of sweeps to include in the averaging.
In continuous sweep mode, the R&S FPC now calculates the moving average over
the number of sweeps you have specified. In single sweep mode, it stops the mea-
surement after finishing the sweeps and averages the traces.
12.8.2 Detector
The number of samples collected in a single sweep usually is very large, especially if
the span is large. However, the display of the R&S FPC can display only a limited num-
ber of results on the y-axis, because it is limited by the display resolution (one pixel
usually combines a large quantity of measurement points). Therefore, it has to reduce
the data and combine measurement results to fit them on the display.
The detector determines the way the R&S FPC combines and displays the results for
one pixel. The data base is the video voltage of the analyzer.
The following detectors are supported.
●
"Auto Peak"
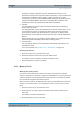
The auto peak detector displays both the highest and the lowest power levels that
were measured in the frequency range covered by a pixel.
The auto peak detector loses no information. If a signal's power level fluctuates (for
example in case of noise), the width of the trace depends on the magnitude of the
signal fluctuation.
●
"Max Peak"
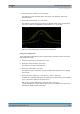
The max peak detector displays only the highest level that was measured in the
frequency range covered by a pixel.
The max peak detector is useful for measurements on pulses or FM signals, for
example.
●
"Min Peak"
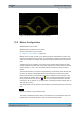
The min peak detector displays only the lowest level that was measured in the fre-
quency range covered by a pixel.
The min peak detector displays sine signals with the correct level and suppresses
noise. Therefore it is useful to find sine signals in the vicinity of noise.
●
"RMS"
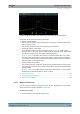
The RMS detector measures the spectral power over one pixel. In case of power
measurements, the RMS detector always shows the true power of a signal, regard-
less of the shape of the signal.
The RMS detector is best for measurements on digitally modulated signals
because it provides stable and true power readings. In combination with a high
sweep time, you can increase the display stability even more because the mea-
surement time for each pixel increases.
Noise measurements also provide stable results if you apply the RMS detector in
combination with a high sweep time.
However, the bandwidth occupied by the signal to be measured should at least
equal the frequency covered by a trace pixel or the selected resolution bandwidth
Trace Configuration