
Software Owner manual

Rockwell Automation Publication MOTION-UM004B-EN-P - October 2012 59
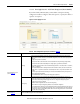
Welcome to Motion Analyzer Software Chapter 1
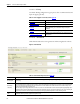
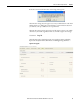
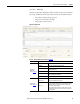
1.2.2.4.4.2.3. Analysis Tab
Click the Analysis tab to display plots of drive module activity in terms of the DC
bus voltage and DC bus current. The analysis activities are described as follows:
• The red line is the bus voltage trip point.
• The green line is the DC bus voltage.
• The grey line is the bus current.
Figure 46 - Analysis Tab
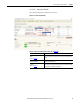
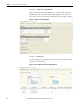
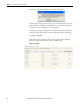
Table 39 - Analysis Tab Properties (refer to Figure 46
)
Parameters Description
Simulation
Parameters
(1)
(refer to Figure 46)
(1) Click Apply to implement these changes.
Shunt On The voltage level where the shunt enables.
Shunt Off The voltage level where the shunt turns off.
Trip
The voltage level where the drive trips on an overvoltage fault by
changing the trip volts.
Resistance The shunt resistance level in ohms.
Power
Changing the power value modifies how much energy the shunt
resistor can dissipate continuously.
Capacitance Changing the capacitance value changes the DC bus capacitance.
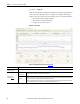
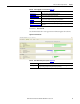
Zoom window
(refer to Figure 46
)
Time From/
Voltage From
Check these boxes to adjust the X- and Y-axis values for the plot.
Click Plot to implement these changes.
Time Slice
The Time Slice variable sets the time interval for the Analysis tab.
Because the shunt switching action is modeled during selection,
this value needs to be very short to obtain an accurate shunt
selection (0.1 ms, for example).
However, if the total cycle time is more than a few seconds, the
calculation time may become excessive. The time is equal to the
longest axis cycle.