
Software Owner manual

Rockwell Automation Publication MOTION-UM004B-EN-P - October 2012 27
Welcome to Motion Analyzer Software Chapter 1
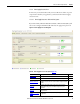
1.2.2.3.1. Top Band
This area lets you define the Time Span to which all graphs should be scaled.
Additionally, this view lets you select a subset of the available axes to view.
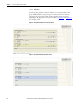
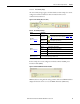
Figure 19 - Top Band of Multiple Profile View
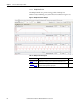
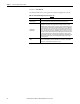
Table 13 - Top Band Example
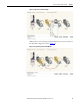
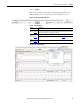
Figure 20 - Selected Axis Example
Option Description
Modify Time Span
(label 1 in Figure 19)
Time span is the length of x-axis on which all the profiles are plotted. Use this option to zoom-
in or zoom-out on the time scale. Enter the minimum and maximum value of the time scale of
interest and click Apply to re-plot all graphs to this scale.
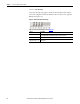
Show Axis
(label 2 in Figure 19
)
Select All to display all axes.
Select Selected (Change) to choose the axis of interest (refer to Figure 20
for typical dialog
box).
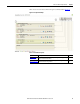
Sort By
(label 3 in Figure 19)
This option lets you sort the axes in the graph area according to the Slot Number or Axis Name.