
Software Owner manual


264 Rockwell Automation Publication MOTION-UM004B-EN-P - October 2012
Chapter 3 Understanding Your System Solution
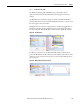
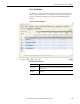
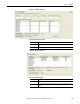
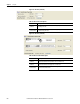
Figure 210 - Segment Plot Dialog Box
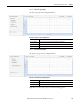
Table 158 - Graph Options
Parameters Description
Reset Zoom Resets the zoom to 1x.
Zoom Lets you zoom in 1x, 2x, 6x or 8x.
Grid Select Normal, Fine, or Remove grid.
Color Adjust the background, curve and grid colors.
Show Curve Select which curves you would like to display on the plot (for example, Distance or Velocity).
Show Y Axis
Toggle the Y-axis labels on and off when more than one curve is shown. This option is only
available on the Profile Plot.