
Software Owner manual

Rockwell Automation Publication MOTION-UM004B-EN-P - October 2012 217
Understanding Your System Solution Chapter 3
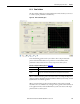
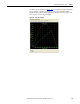
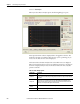
The Thermal tab displays the output of drive and motor thermal models that
reside in the drive firmware.
Figure 162 - Thermal Graph
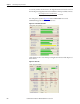
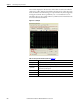
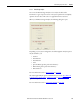
Table 128 - Axis System Performance (label 2 in Figure 155
)
Parameters Description
Motor/Drive Capacity Select the thermal curves you would like displayed on the graph.
Steady State/Single Cycle Select whether to view thermal data for Steady State or for a Single Cycle.
Full/Auto Scale
Select whether to view the data on the Full Scale graph (y-axis values from zero to the
maximum value) or Auto Scale graph (y-axis values from the minimum value to the
maximum value).
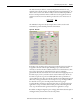
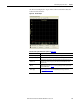
RBM tab
This graph is available after a Resistive Brake Module (RBM) has been added to the System
BOM (bill of materials) in the Axis Stop
tab. The graph displays the Velocity versus Time
data for the RBM module.
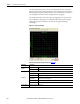
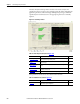
Power-Supply
This graph is available after a Power Supply Analysis has been performed on the system in
the Power Supply/Accessories View
. This graph displays the Voltage and Current
Simulation data.