
Software Owner manual

216 Rockwell Automation Publication MOTION-UM004B-EN-P - October 2012
Chapter 3 Understanding Your System Solution
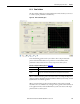
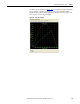
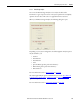
The Load tab displays the characteristics of the load alone without the influence
of the motor or drive. It may be viewed before selecting motor or drive. For rotary
loads, the influence of transmission/gear component ratio may be investigated by
moving the ratio slider. This is a preliminary test—no transmission losses are
included at this stage. For example, efficiency as defined on the Transmission tab
is not factored into transmissions.
Figure 161 - Load Graph
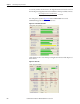
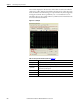
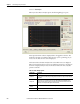
Table 127 - Axis System Performance (label 2 in Figure 155
)
Parameters Description
Summary Displays the data only for the critical profile segment.
All Segments Displays the data for all profile segments on the graph.
Segmentwise
Displays the data for one profile segment at a time. Use the Forward and Backward arrows to
navigate between profile segments.
Show RMS Torque Select to display the RMS (root mean squared) torque value on the graph.
Gearbox Ratio Use the slider to adjust the Gearbox Ratio and observe the effect on the Torque-Speed graph.
Quadrant Select the option to view either the Single or Four quadrant graph.