
Software Owner manual

214 Rockwell Automation Publication MOTION-UM004B-EN-P - October 2012
Chapter 3 Understanding Your System Solution
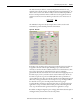
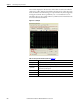
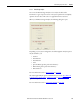
The Axis System Performance portion of the detailed Solution view provides
graphical representations of the performance characteristics for the system. If you
click the graph, the graph expands to fill your screen. In addition, as you mouse
over the graph, the X- and Y-values are displayed below the graph.
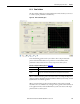
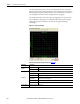
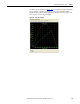
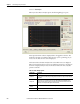
The Torque-Speed tab contains the torque/speed graph for the selected motor/
drive combination. This graph is created dynamically, which means that if the
supply voltage changes in the Motor or Drive tab, the graph will change
accordingly.
Figure 159 - Torque-Speed Graph
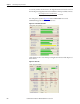
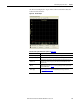
Table 126 - Axis System Performance (label 2 in Figure 155
)
Parameters Description
Quadrant
Single Displays single quadrant graph.
Four Displays four quadrant graph.
Graph Detail
Opens the Torque Speed Details dialog box.
Summary Displays only the critical profile segment data on the graph.
All Segments Displays the data for all profile segments on the graph.
Segmentwise
Displays the data for one profile segment at a time. Use the Forward and Backward arrows to
navigate between profile segments.
Show RMS Torque Check to display the RMS (root mean squared) torque value on the graph.
Auto Cycle Check to highlight each data point, in order, at the specified update rate.
X-/Y- Axis Button Flips the X- and Y-axes on the graph.