
Software Owner manual

Rockwell Automation Publication MOTION-UM004B-EN-P - October 2012 151
Sizing Your System Chapter 2
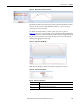
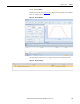
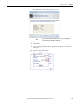
Figure 112 - Main Profile Plot X and Y-axis Values
The Profile Zoom Plot sub-window appears below the Main Profile Plot window.
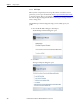
Click the arrows, below the Main Profile Plot window, to open it. Click the
arrows again to close the window.
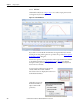
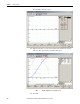
The Profile Zoom Plot window contains a slider (refer to the red box in
Figure 113
) that you can move along the motion profile by clicking and dragging
it. As the slider moves, the Main Profile Plot window displays a magnified view of
the portion of the plot that is selected by the slider. You can resize the slider by
clicking and dragging from either edge.
Figure 113 - Profile Zoom Plot Window
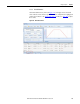
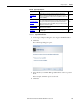
Right-click the Profile Zoom Plot sub-window to display these options.
Figure 114 - Profile Zoom Plot Options
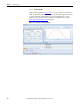
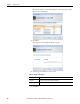
Table 85 - Profile Zoom Plot Options
Parameters Description
Grid Select Normal, Fine, or Remove grid.
Color Adjust the background, curve, and grid colors.