
Software Owner manual

Rockwell Automation Publication MOTION-UM004B-EN-P - October 2012 141
Sizing Your System Chapter 2
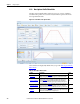
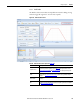
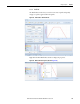
Figure 101 - Segment Plot Example
Segment Plot
(refer to label 2 in Figure 100
and the example in
Figure 101)
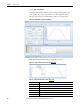
Reset Zoom
(1)
Resets the zoom to 1x.
Zoom
(1)
Magnifies 1x, 2x, 6x, or 8x.
Grid
(1)
Select Normal, Fine or Remove Grid to change the display.
Color
(1)
Adjust the background, curve and grid colors.
Show Curve
(1)
Select which curves you would like to display on the plot.
Show Y Axis
(1)
Toggle the Y-axis labels on and off when more than one curve is shown.
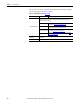
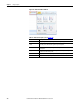
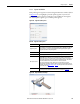
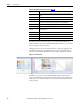
Vertical Bar
This adjusts the height/velocity component of the motion profile. As you increase the value of this slider, more time is
spent accelerating and decelerating the load and less time is spent dwelling at a constant velocity.
Horizontal Bar
This adjusts the ratio of the time spent accelerating to the time spent decelerating for the motion profile. A negative
value on the slider indicates that more time is spent decelerating the load than accelerating it. A positive value on the
slider indicates that more time is spent accelerating the load than decelerating it.
(1) In addition to the parameters in Figure 100, these options are also available when you right-click the Segment Plot window.
Table 75 - Less Options Profile Editor Properties
Parameter Description