
Software Owner manual

Rockwell Automation Publication MOTION-UM004B-EN-P - October 2012 115
Sizing Your System Chapter 2
Table 68 - Four Bar Linkage Properties
Parameter Description
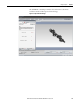
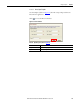
Animated Display
(1)
(label 1 in Figure 92)
Vertical Slider
(left)
This slider sets the crankshaft inclination and should be set before starting the animation. Click 0y to set the angle to 90°. The current
angle is displayed in the Mechanical Data window.
Horizontal Slider
(top)
This slider sets the linear slide inclination. Click 0z to set the angle to 0°. The current angle is displayed in the Mechanical Data window.
The true angle to the horizontal is dependent on both slider positions because it is a compound angle.
Horizontal Slider
(scale)
This slider sets the display scale.
Horizontal Slider
(Speed)
This slider sets the animation speed. The black arrow in the plot represents the external force, and the arrow length is proportional to
the applied force.
Animate Click to run the simulated crank image through the specified motion profile.
Stop Click to stop the animation.
Analyze Click to display the bar graphs that show the contribution of each mechanical component to the inertia and torque values.
Calculate Click to calculate the external torque and reflected inertia values that will be applied.
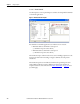
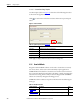
Mechanical Data
(label 2 in Figure 92
)
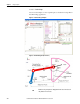
Link 1 Length Distance between Pivot 1 and Pivot 2.
Link 1 Inertia
(2)
Inertia of Link 1.
Link 1 Start Angle Initial angle between Link 1 and X Axis. Angular load profile only.
Link 2 Length Distance between Pivot 2 and Pivot 3.
Link 2 Mass Mass of Link 2.
Link 2 CG Link 2 Center of Gravity with respect to Pivot 2.
Link 2 Inertia
(1)
Inertia of Link 2 about its own center of gravity.
Load Pivot X X distance between Pivot 1 and Pivot 4.
Load Pivot Y Y distance between Pivot 1 and Pivot 4.
Load Link Length Distance between Pivot 3 and Pivot 4.
Load Inertia Inertia of the load (Link 3) about its own center of gravity.
Load Mass Mass of the load (Link 3.)
Load G of G Radius Distance between Pivot 4 and center of gravity of the load (Link 3.)
Load G of G Angle Angle between the lines that make up the center of gravity of the load (Link 3), Pivot 4, and Pivot 3.
Link 1 Start Angle Link 1 angle when force is applied.
Force at Start Magnitude of the force at the starting point.
Force at End
Magnitude of the force at the ending point. If the Force at Start is different from the Force at End, the force varies between these two
limits according to gudgeon pin position or crank angle. If the values are equal, a constant force is applied.
Force Orientation Force orientation from the X axis.
Draw Start
Position
Click to show the geometry at the start angle/position.
Export Logix Cam
Click to transfer the geometrical data to the clipboard for pasting into the RSLogix 5000 Cam Editor. The master axis is a virtual axis
while the slave axis is the crank axis. A trapezoidal move of the virtual axis then produces a trapezoidal profile at the gudgeon pin. The
master data must increase positive so only that part of the cam that satisfies this requirement is exported.
Pivot 1 Axis
Inclination
Displayed value is the angle of the crank shaft with respect to the XY (horizontal) plane. 90° indicates vertical, and gravity has no
effect.