
Quick Start Owner's manual
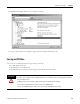
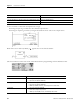
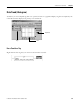

Table Of Contents
- 1756-QS001E-EN-P, Logix5000 Controllers Quick Start
- Summary of Changes
- Table of Contents
- 1 - Program and Test a Simple Project
- What You Need
- Before You Begin
- Follow These Steps
- Create a Project for the Controller
- Add Your I/O Modules
- Look at Your I/O Data
- Ladder Logic
- Enter a Function Block Diagram
- Assign Alias Tags for Your Devices
- Establish a Serial Connection to the Controller
- Download a Project to the Controller
- Select the Operating Mode of the Controller
- 2 - Organize a Project
- 3 - Program Add-On Instructions
- What You Need
- Follow These Steps
- Insert an Add-On Instruction
- Copy an Add-On Instruction Definition
- Import an Add-On Instruction Definition
- Access a Parameter That Is Not Visible
- Monitor or Change the Value of a Parameter of an Add-On Instruction
- View the Logic of an Add-On Instruction
- Edit and Monitor an Add-On Instruction
- Update an Add-On Instruction to a Newer Revision
- 4 - Program an Equipment Phase
- 5 - Program a Project Offline
- 6 - Document a Project
- 7 - Go Online to the Controller
- 8 - Program a Project Online
- 9 - Troubleshoot the Controller
- Index
- Back Cover
Publication 1756-QS001E-EN-P - October 2009 135
Troubleshoot the Controller Chapter 7
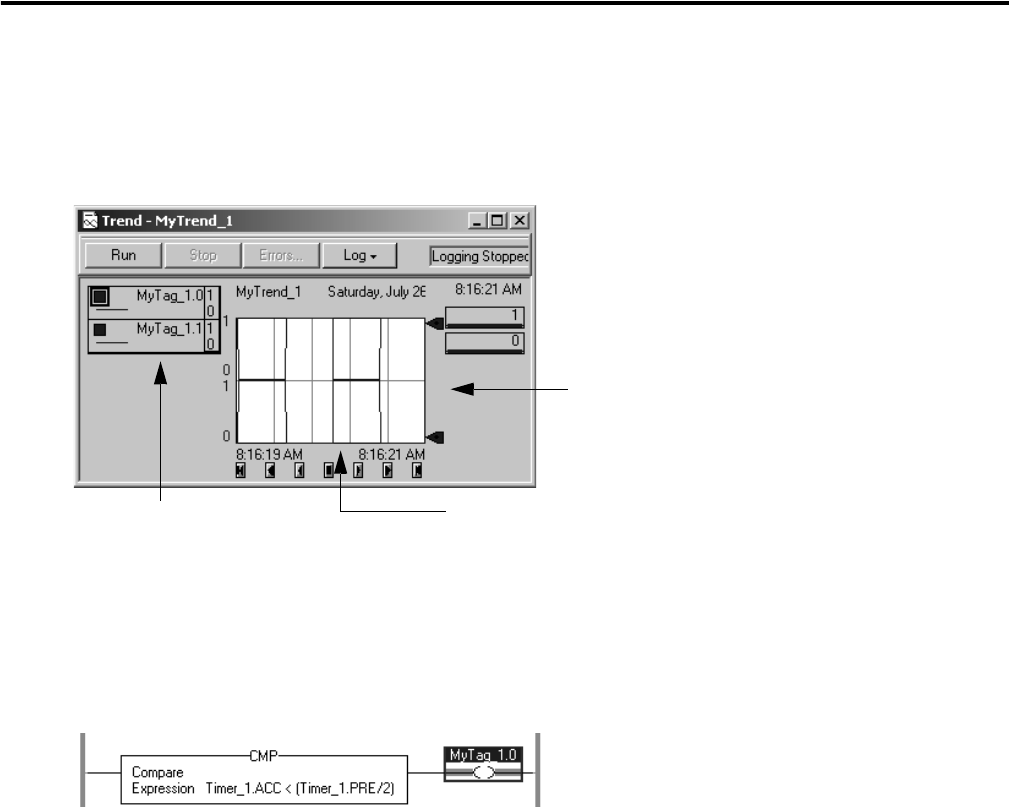
Data Trend (Histogram)
Trends let you view sampled tag data over a period of time on a graphical display. Tag data is sampled by the
controller and then displayed as point(s) on a trend chart.
Run a Trend for a Tag
Right-click the first tag that you want to trend and choose Trend.
Tags
Time
Tag Values