
Energy Saving Package Instruction Manual


C-2 FanMaster Screens and Field Descriptions
Allen-Bradley® FanMaster™ Energy Saving Package Installation Manual - Publication FANM-IN001B-EN-P – December, 2009 PN-65329
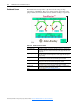
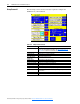
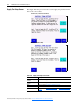
Dashboard Screen
The Dashboard screen provides a quick view of the energy savings
performance of FanMaster. The green, yellow and red color bands on the
gauges identify the most desirable to least desirable readings, respectively.
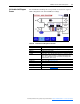
Table C.A Dashboard Screen Fields
Field Name Description
Avg. Fan Speed % Average percentage of full speed of the fan(s) speed since start up or the
last time the logs were cleared. A lower value on this gauge indicates lower
fan speeds.
Avg. Energy Savings % Average energy (cost of fan electricity) savings since the start up or the last
time the logs were cleared. A higher value on this gauge indicates higher
energy savings.
Savings MTD Current month-to-date electrical and cooling and heating (if applicable)
cost savings since start up or the last time the logs were cleared.
Savings YTD Current year-to-date electrical and cooling and heating (if applicable) cost
savings since start up or the last time the logs were cleared.
Savings PROJ/YR Projected year-to-date electrical and cooling and heating (if applicable)
cost savings since start up or the last time the logs were cleared.
Savings LIFE Total electrical and cooling and heating (if applicable) cost savings since
start up or the last time the logs were cleared.
Next Press to view the Air Handler Unit Diagram Screen
.