
t Owner manual

196 Rockwell Automation Publication IASIMP-QS016C-EN-P - October 2014
Chapter 9 FactoryTalk EnergyMetrix Software Reports and Charts
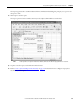
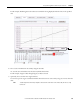
For this example, electric consumption from three other production areas is selected and viewed relative to the
Electric Main consumption data.
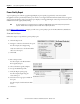
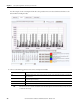
8. Choose other charting options to view, remove, and export trend data.
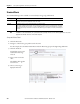
Click This Button To
Hide Temporarily hide the view of a tag on the trend chart. The tag is still selected but not visible. To view the tag
again, click Show.
Bar Display a bar chart for the selected tag. The button toggles between Bar and Line so you can choose the
desired chart type for each tag.
Remove Permanently remove a tag from the chart.
Export Data Save the data series displayed in the chart to a .csv file.
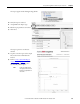
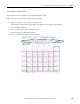
TIP
Move the mouse cursor over the trend chart until a menu bar appears. From this menu bar, you may save, print,
or email the chart image.