INTEGRATED PRODUCTION & PERFORMANCE SUITE Asset Management User Manual PUBLICATION FTEM-UM002A-EN-P – JANUARY 2014
FactoryTalk EnergyMetrix Software Contact Rockwell Customer Support Telephone — 1.440.646.3434 Online Support — http://www.rockwellautomation.com/support/ Copyright Notice © 2014 Rockwell Automation Technologies, Inc. All rights reserved. Printed in USA. This document and any accompanying Rockwell Software products are copyrighted by Rockwell Automation Technologies, Inc. Any reproduction and/or distribution without prior written consent from Rockwell Automation Technologies, Inc.
CONTENTS Chapter 1 Overview . . . . . . . . . . . . . . . . . . . . . . . . . . . . . . . . . . . . . . . . . . . . . . 7 Features and Benefits . . . . . . . . . . . . . . . . . . . . . . . . . . . . . . . . . . . . . . 7 FactoryTalk EnergyMetrix Software Components . . . . . . . . . . . . . . . . . . . . 9 Chapter 2 FactoryTalk EnergyMetrix Web Interface Tour . . . . . . . . . . . . . . . . . . . 15 System Tab . . . . . . . . . . . . . . . . . . . . . . . . . . . . . . . . . . . . . . . . . . . .
FactoryTalk EnergyMetrix Software Set up a Report . . . . . . . . . . . . . . . . . . . . . . . . . . . . . . . . . . . . . . . . 107 Run Reports Automatically. . . . . . . . . . . . . . . . . . . . . . . . . . . . . . . . . 109 Set up a Billing Rate Schedule . . . . . . . . . . . . . . . . . . . . . . . . . . . . . . 112 Set-up Alarming . . . . . . . . . . . . . . . . . . . . . . . . . . . . . . . . . . . . . . . . 146 Chapter 6 How to Set up a Personalized Start Page . . . . . . . . . . . . . . . . . . .
Contents Configure the Report Object . . . . . . . . . . . . . . . . . . . . . . . . . . . . . . . 221 Add a Report Object to the MPR . . . . . . . . . . . . . . . . . . . . . . . . . . . . . 222 Run the MPR . . . . . . . . . . . . . . . . . . . . . . . . . . . . . . . . . . . . . . . . . . 224 Selecting Groups and Meters in the MPR . . . . . . . . . . . . . . . . . . . . . . . . 226 Use the MPR for Cost Allocation . . . . . . . . . . . . . . . . . . . . . . . . . . . . . 228 The MPR Object Model . . . . .
FactoryTalk EnergyMetrix Software Notes: 6
CHAPTER 1 Overview FactoryTalk® EnergyMetrix softwear is a modular, scalable, web-enabled, client/server energy information, and management application. It connects energy-related data sources to a Microsoft SQL database and presents energy information in ways that enable you to monitor and manage your energy use to maximize the value of your enterprise. FactoryTalk EnergyMetrix is built by using Microsoft.
FactoryTalk EnergyMetrix Software FactoryTalk EnergyMetrix software helps you connect to metering points right from your desktop PC. Connect to Allen-Bradley power monitors and other devices through RSLinx Classic Lite: RS232, RS-485, Ethernet, DeviceNet, RIO pass-thru (RSLinx Classic Lite is included). Connects to FactoryTalk Live Data server on an Ethernet network. Connect to third party meters and controllers through OPC; more than ten meters requires the FTEMOPC option.
1 • Overview Create and print daily or monthly cost and billing reports by: Meter Business group Department Site Create energy budgets and forecasts Compare and contrast alternative utility rates; do ‘what-if’ for other rate structures Print and store all reports and charts FactoryTalk EnergyMetrix software is a sophisticated power quality analysis tool Overlay waveforms to correlate phase to phase relationships Plot Transients, Surges, and Sags on ITI (CBEMA Curves) Dis
FactoryTalk EnergyMetrix Software If you are upgrading from an existing installation of RSEnergyMetrix software, your existing licenses are supported, including existing meter counts. FactoryTalk EnergyMetrix software only supports FactoryTalk Activation. If you plan to upgrade from an installation of RSEnergyMetrix that uses EVRSI Master Disk activation, please contact Rockwell Automation customer service to convert to FT Activation.
1 • Overview Use Microsoft Internet Explorer to interact with RT. RT complements Manager's data logging, cost allocation, profiling and reporting functions by allowing you to configure power monitors and to view, print, and save data from power monitors.
FactoryTalk EnergyMetrix Software Overlay Chart Graphically displays a tag value with user-definable overlays. ChartsPlus is best viewed with a Windows appearance scheme with standard sized fonts. Windows appearance schemes with large or extra large fonts may distort the appearance of ChartsPlus. ReportsPlus ReportsPlus provides you a package of enhanced reports in addition to the standard reports included in Manager.
1 • Overview The efficiency report will calculate not only average efficiency over the selected time range, but also snapshots of the efficiency during the range at user-specified intervals. Report output will be graphical and tabular, with a graph of efficiency versus time. The efficiency report is based on a simple Rate Schedule script. Load Factor Report The Load Factor report lists minimum, average and peak real power demand, load factor and time of peak demand.
FactoryTalk EnergyMetrix Software Notes: 14
CHAPTER 2 FactoryTalk EnergyMetrix Web Interface Tour To access the FactoryTalk EnergyMetrix web page, browse to the following address: http:/// FTEnergyMetrix After you log in, the client desktop appears. On the left is the navigation tree. On the right is the detail pane.
FactoryTalk EnergyMetrix Software System Tab The System tab in the navigation tree contains a number of folders and links that provide access to setup items such as Devices, Groups, security settings (Roles and Users), Rate Schedules, and Multi-Purpose Report Scripts, as well as links to the System Status, My User Settings, Unit Setup, Configuration, System Configuration Report, and About pages.
2 • FactoryTalk EnergyMetrix Web Interface Tour Device Communication Errors This screen displays by default a list of device communication errors since your last login. You can also select other error ranges. For example, let's look at all errors: Click on a Device Name link to expand to a detailed list of communication errors associated with the Device. You can purge errors for individual devices or click the Purge All button and confirm to purge errors associated with all Devices.
FactoryTalk EnergyMetrix Software User Monitor This tab shows a list of users that are currently logged in to the system. Groups Click the Group link in the System tab to view the groups that have been set up. A Group is a named collection of Devices and Meters that represents a subdivision of your enterprise such as a department, division or process. Groups contain Meters, which can be shared between Groups. A Domain is a Group that is assigned Roles and Users.
2 • FactoryTalk EnergyMetrix Web Interface Tour Roles and Users Access to the application and its functions is controlled by means of Roles and Users. A role is a named collection of privileges assigned to various users to manage security. Roles can be global or domain specific. A User is a named set of security credentials (user name and password) that permit an individual to access the privileges defined in the Role assigned to the User. More than one Role can be assigned to a User.
FactoryTalk EnergyMetrix Software The rate schedule model is designed to be very flexible so you can accommodate a wide variety of utility tariffs. Multi-purpose Report Scripts The Multi-purpose Report (MPR) is a free-form report driven by script code stored in a Multi-purpose Report Script. The MPR is part of the ReportsPlus Reports option. A MPR Script defines what a MPR contains and what it looks like. A MPR script is conceptually similar to a rate schedule.
2 • FactoryTalk EnergyMetrix Web Interface Tour Rich Text Box The Rich Text Box provides a way to place text on a MPR. The MPR script contains code that creates the Rich Text Box and controls its location, size, content and formatting. Page Header and Footer The page header contains identifying elements such as the report title, the report headings from the Group setup, the report time range and time zone, and a user-selectable graphic element.
FactoryTalk EnergyMetrix Software Unit Setup The Unit Setup screen provides menus that let you add, delete, and edit Value Types, Base Units, and Units. The FactoryTalk EnergyMetrix collection of base units includes many that are commonly uses in energy management applications. The default collection of units is based on the base units and includes a scaling factor which relates it to the base unit.
2 • FactoryTalk EnergyMetrix Web Interface Tour System Configuration The Configuration page under the System tab provides a means for setting a variety of program options. To access the Configuration page, select the System tab and then select the Configuration item in the navigation tree. Click the Edit button to change settings. You must have Edit System Configurations privileges to make changes.
FactoryTalk EnergyMetrix Software Logger Configuration Derived tag delay - specifies how long after meter data is polled that derived tags are calculated. Default is 5 minutes Maximum active DTL operations - specifies the maximum concurrent messages with RSLinx Classic and hence devices. Range is 1 to 35. Default is 20. It is unlikely that you will need to adjust this setting Miscellaneous Settings SQL command timeout delay - default 120 seconds.
2 • FactoryTalk EnergyMetrix Web Interface Tour My User Settings This screen shows the user settings of the currently logged-in user. A user can change their personal password here. It also lets a user change other user settings, provided that the role associated with the currently logged-in user has the privilege to edit users. If you wish to receive alarm notifications by email, be sure to check the Enable alarm notifications checkbox on this page.
FactoryTalk EnergyMetrix Software Selecting the Meters tab does not change the detail pane content. Select a Group or Domain to view aggregated information from the Meters the group contains. When you first select a Meter, the Meter Data tab is selected. This screen lets you view the logged meter data. The display is arranged by log rate. The user time zone is selected by default.
2 • FactoryTalk EnergyMetrix Web Interface Tour The Meter trend display lets you select and view tags as their values vary by time. You can select up to five tags from one or more meters. Each pen can be individually selected to be displayed as a line chart or bar chart. The user time zone is selected by default. You can select a different time zone for the trend and the start and end dates from the calendars. Or, enter start and end dates into the date fields and click the Go button.
FactoryTalk EnergyMetrix Software To zoom in to a day, click on the day in the calendar. You can overlay days by selecting additional days from the small calendar under the zoomed display. Meter Setup The meter setup screen provides tools to allow you to create, modify, and delete Meters, add and modify meter tags, and set up alarms.
2 • FactoryTalk EnergyMetrix Web Interface Tour Reports Tab Standard reporting converts the energy and production data logged in the database into information you can use to manage your business, improve efficiency and reduce costs. Standard reports can be run on demand, automatically on a configurable schedule, or event-driven in response to an alarm condition. Consumption Reports Reports consumption values (for example kWH and kVARh) for selected meters or groups for a specified date/time range.
FactoryTalk EnergyMetrix Software Power Quality Reports Runs a report that combines a graph and a grid display of power quality (sag and swell) events. The power quality report can only be used with Allen-Bradley PowerMonitor 3000 M6 and M8 models with their sag and swell setpoints configured. The Enable PQ events logging flag must be selected in the Device setup page.
2 • FactoryTalk EnergyMetrix Web Interface Tour Load Factor Report The Load Factor report lists minimum, average and peak real power demand, load factor and time of peak demand. You can select Meters to include in the report, as well as the report date range and calculation intervals. The report output contains a tabular report and a graphical chart.
FactoryTalk EnergyMetrix Software Notes: 32
CHAPTER 3 Installation Contents of Installation DVD The installation DVD contains the following required components: FactoryTalk EnergyMetrix 2.10.00 FactoryTalk Activation Manager v 3.60.00 (CPR9 SR6) FactoryTalk Services Platform v 2.60.00 (CPR9 SR6) RSLinx Classic Lite v 3.60 (CPR 9 SR6) Microsoft .NET Framework 3.5 SP1 And the following optional components and resources: RSLinx Enterprise 5.60.
FactoryTalk EnergyMetrix Software Server Software Requirements for Installing FactoryTalk EnergyMetrix Windows 2003 Server or Windows 2008 Server, Application Server role. For 64-bit operating systems, RSLinx Classic version 2.60 (CPR9 SR6) or later must be installed. Windows 2000 Server is not supported. Microsoft SQL Server 2005 or 2008, installed with mixed-mode authentication (Windows and SQL). TCP/IP access must be enabled.
3 • Installation Processor, RAM and hard drive as noted below DVD drive One or more Ethernet network ports Internet access Monitor, keyboard, pointing device (mouse) Low-end Server Single 2 GHz Pentium 4 1…2 GB RAM 80 GB hard disk Mid-range Server 2 or 4 CPU 2 GHz Pentium 4 or better 2…4 GB RAM 160 GB hard disk (with separate disks for operating system and log files and RAID 5 for main database files preferred) 35
FactoryTalk EnergyMetrix Software High-end Server High-end server requirements are very dependent upon the user's application requirements. Please contact Rockwell Automation for assistance in specifying hardware for a high-end server. Client Requirements The following are the client requirements for compatibility with FactoryTalk EnergyMetrix software: Microsoft Windows XP Professional, Vista Professional, Windows 7 (Windows 2000 is not supported) operating system.
3 • Installation Installation (64-bit) Perform the following steps while logged in as a Machine Administrator. Configure Windows 2008 Server Start with a clean Windows Server 2008 R2 SP1. 1. If it hasn’t launched automatically, launch Server Manager. Wait until Server Manager has finished collecting data. 2. Right-click Roles and select Add Roles. 3. Click Next on Before You Begin page. 4. Select Application Server. 5. Click Add Required Features. 6. Click Next. 7. Click Next. 8.
FactoryTalk EnergyMetrix Software 11. Click Next. 12. Scroll down in the Role Services window and then select IIS 6 Management Compatibility 13. Click Next 14. Click Install 15. Wait while installation proceeds 16. Click Close when done We recommend that you disable Internet Explorer Enhanced Security Configuration. 17. To do this, locate the Configure IE ESC link in the Security section In the Server Manager. 18. Click the link, turn off IE ESC for Administrators, and then click OK.
3 • Installation Install SQL Server 2008 R2 Microsoft SQL Server 2008 R2 must be installed on the local server even if the FactoryTalk EnergyMetrix database is to be hosted on another machine. 1. Insert disk into CD/DVD drive. 2. If necessary, run SETUP.EXE and click Yes to allow SQL Server 2008 R2 to install on the computer. 3. Review the documentation in the SQL Server Installation Center window. 4. Install the upgrade advisor if desired. 5. Click the Installation link in the menu. 6.
FactoryTalk EnergyMetrix Software 15. Click Next. 16. Click Next. 17. Leave the Default instance selected, click Next. 18. On the Disk Space Requirements page, click Next. 19. On the Service Account dialog box, Click Use the same account for all SQL Server services. 20. Select NT AUTHORITY\SYSTEM in the dialog box and then click OK. 21. Click Next. 22. On the Database Engine Configuration page, select Mixed Mode. 23. Enter a password. Record the password in a safe location.
3 • Installation Enable 32-bit Applications 1. Using Internet Information Services (IIS) Manager -> Application Pools -> DefautlAppPool -> Advanced Settings, set Enable 32-Bit Applications to True. 2. Click OK. Install FactoryTalk EnergyMetrix Software Version 2.10.00 1. Insert the FactoryTalk EnergyMetrix installation DVD into the CD/DVD drive. If needed, browse the DVD and launch Autorun.exe to access the installation menu. Perform the following steps from the installation menu. 2.
FactoryTalk EnergyMetrix Software h. When prompted, reboot the server. 9. Install RSLinx Classic Lite software version 3.60 (CPR 9 SR6). a. From the FactoryTalk EnergyMetrix installation menu, click RSLinx Lite 2.57.00. b. Complete the steps to install RSLinx Classic Lite. c. After installation, RSLinx Classic starts as an application. Refer to the RSLinx application notes section below for tips on using RSLinx Classic on Windows 2008 Server R2. Do not install Microsoft .NET Framework 3.
3 • Installation The RT and ChartsPlus options do not require specific security configuration in FactoryTalk EnergyMetrix software. They run as Microsoft ClickOnce applications by default. You will need to grant permission for the options to run, but only one time on each computer. When you set up Devices such as power monitors and PLCs in FactoryTalk EnergyMetrix software, you will need to access RSLinx Classic software running on the server to configure drivers and network addresses of devices.
FactoryTalk EnergyMetrix Software Installation (32-bit) See Installation (64-bit) on page 37 for instructions to install FactoryTalk EnergyMetrix software on a 64-bit operating system. Pre-installation Checks 1. Check out the server for required customer-provided software: Windows 2003 R2 Server, set up in the Application Server role. ASPNET must be installed. Active Server Pages must be enabled in Internet Information Services. Network COM+ Access must be enabled.
3 • Installation 2. If not already installed, install Microsoft SQL Server 2005 or 2008 (NOT included in FactoryTalk EnergyMetrix base software but 2008 is available as a bundled option). SQL Server must be set up with mixed-mode authentication (Windows and SQL Server). You can make this selection during initial installation or by using Enterprise Manager and editing the server properties, security tab after installation.
FactoryTalk EnergyMetrix Software Then, enter the SQL system administrator account login credentials. c. Accept the remaining prompts. The installation will proceed. During the installation, the FactoryTalk EnergyMetrix SQL database is created, populated with stock values and updated to the current version. d. When prompted, reboot the server to complete the installation. 5.
3 • Installation Activate FactoryTalk EnergyMetrix Software FactoryTalk EnergyMetrix software is one software product. The Manager and Options are enabled by installing activations. For example, one activation enables Manager, another enables the Real Time (RT) option, and one enables the ChartsPlus option. It is the customer's responsibility to observe the requirements of all software licenses.
FactoryTalk EnergyMetrix Software How to Activate Your Software To activate FactoryTalk EnergyMetrix software, perform the following steps. 1. Install the FactoryTalk Manager software available from the Optional Steps screen of the Install program. 2. Once FactoryTalk Manager is installed, click Start > Programs > Rockwell Software > FactoryTalk Activation > FactoryTalk Manager to launch the FactoryTalk Manager. 3. Click Get Activations. 4.
CHAPTER 4 Set up Your System Architecture We suggest that you set up a system configuration that helps you visualize and understand the energy use patterns of your plant or enterprise. A project is organized in a familiar tree-structured fashion. The user constructs a tree made up of domains and groups in a hierarchy. A typical and popular way to organize a project tree is shown below. At the ‘root’ of the tree is a top-level domain that represents a plant named ‘Efficient Industries Plant 1’.
FactoryTalk EnergyMetrix Software You can assign a number of meters to a Group or domain, which represents a department, division, or process. Meters can be assigned to multiple groups and domains, letting you create different views of meter data. Groups and domains can be nested. A user will encounter the project tree in several places as he or she navigates around the web interface. In the System tab, the entire tree is found in the Groups folder.
4 • Set up Your System Architecture 3. Click Add. 4. Enter the appropriate information into the data fields. Parent group - if this is a subgroup, type in the name of its parent group. This group is a domain checkbox - check if this group is to be a domain that Roles, Meters and Reports can be assigned to. Name - type in a name for this group. Notes - enter any additional information you desire in the Notes field.
FactoryTalk EnergyMetrix Software Name Fields Name fields can be up to 50 characters in length, except Rate Schedule names can be any length. Names do not need to be unique, although it is recommended that you select names that make the item easy to recognize. There are no restrictions on character usage, except the following: Group and domain names cannot contain period (.), single quote (‘) or pound sign (#) characters. Meter and meter tag names cannot contain period (.
4 • Set up Your System Architecture Delete a Group or Domain You can delete a group or domain by following these steps. Deleting a group also deletes all Devices and Meters assigned to the group, and purges all data associated with those meters in the database. When a large quantity of data is purged, it is possible that a timeout error will occur in Microsoft SQL server, requiring a server restart. 1. Select the Group you wish to delete in the System tab, Groups folder. 2.
FactoryTalk EnergyMetrix Software Create a Role To create a Role, navigate to the Roles and Users folder under the System tab in the navigation tree. 1. Click Add on the Role Setup screen. 2. Select a Parent Group from the pull-down menu. If the Role is to be assigned Global scope, select None. Otherwise, select the desired Group (only groups that are Domains appear in the list). Roles that are assigned to domains can only be assigned to Users assigned to the same group or domain. 3.
4 • Set up Your System Architecture Create a New User To create a new user, follow these steps. 1. From the Role Setup screen, click the Add User link. 2. Fill in the User Setup information fields. Enter the User name to be used to log in. If using Windows Active Directory security, the username must be of the form DomainName\UserName used to log in to Windows. Enter additional information such as first and last names, email address, telephone, fax and pager numbers. Enter a Password.
FactoryTalk EnergyMetrix Software Enter a language preference (future functionality). Un-check the checkbox to disable alarm notifications by email if desired. 3. Select User Roles by checking the applicable check boxes. More than one Role can be assigned to a User.
4 • Set up Your System Architecture Overview of Privileges Privileges apply only within the Parent Domain of the Role. Privileges assigned to Global Roles apply within the entire project.
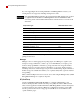
FactoryTalk EnergyMetrix Software Privilege Name Description Included in Default Role Definition Admin Edit Reports Add, delete, and modify Reports and their properties View Custom Pages Guest • • Edit Custom Pages Add, delete, and modify Custom Pages • View Report Jobs View the setup information for auto-run Report Jobs • Edit Report Jobs Create and edit auto-run Report Jobs • Purge Logged Data Purge meter data from the database • View Multi-purpose Report View Multi-purpose Report Scr
4 • Set up Your System Architecture PowerMonitor 500 Unit Connects to an Allen-Bradley PowerMonitor 500 panel-mounted meter by using the Modbus RTU master driver integral to FactoryTalk EnergyMetrix software. PowerMonitor 500 units can connect to the FactoryTalk EnergyMetrix server using serial multidrop (RS-485) or Ethernet communication (using a serial to Ethernet gateway). PowerMonitor 3000 (model) Unit on (communication type) Connects to an Allen-Bradley 1404 PowerMonitor 3000.
FactoryTalk EnergyMetrix Software OPC Server on an Ethernet Network Connects to the RSLinx Classic OPC server or a 3rd party OPC server such as Kepware. OPC devices and meters allow FactoryTalk EnergyMetrix to communicate with a wide variety of Rockwell Automation and third-party devices by using OPC. Connection to third party OPC servers such as Kepware require installation of the FTEMOPC 3rd party communication option. The OPC Browser may be used for setting up Devices, Meters, and Meter tags.
4 • Set up Your System Architecture SLC 500 Controller on (communication type) Connects to an Allen-Bradley SLC 500 programmable controller. The following communication networks are supported: Ethernet network - CSP/PCCC addressing Serial network - DF1 full-duplex DH+ network - Data Highway Plus ControlLogix Controller on (communication type) Connects to an Allen-Bradley ControlLogix (or Logix family) controller, such as CompactLogix controller.
FactoryTalk EnergyMetrix Software PowerMonitor Unit on the Remote I/O Network Connects to an Allen-Bradley 1400 PowerMonitor Unit. The only support communication is Remote I/O. Must have a parent device such as an Allen-Bradley PLC-5, SLC 500, or ControlLogix controller. Ethernet Energy Module (model) on an Ethernet Network Connects to an Allen-Bradley 1803-EEM controller designed for totalizing pulse and analog legacy meters.
4 • Set up Your System Architecture 4. Click Add a device. 5. Enter information into the Device Information fields. The device setup page may change when you select a Device Class. 6. Enter information into the Device Communication fields. 7. Click Save to create the new device, or Cancel to discard your device settings.
FactoryTalk EnergyMetrix Software Device Setup Page Elements These buttons appear when viewing the device setup: These buttons appear when adding a new device or editing an existing device setup: Edit - Opens the device setup screen in edit mode. Add - Opens a new device setup screen in edit mode. Copy - Opens a new device setup screen with a copy of the existing device setup information. Delete - Deletes the device and all meters attached to it. Requires confirmation.
4 • Set up Your System Architecture Device Information Enable Check Boxes The enable check boxes appear in both view and edit modes. In edit mode they can be clicked and unclicked. In view mode they are grayed out. Enable Device - Turns on and off communication between FactoryTalk EnergyMetrix and the device. A device must be enabled for any of the other enables to be effective. Enable Real-time Logging - Turns on and off logging of meter tags in meters attached to the device.
FactoryTalk EnergyMetrix Software Name - Every device must have a Name. See Name Fields on page 52 for more information. The name should uniquely identify the device, since: The device name without group affiliation will be picked from a pull-down menu during meter setup. The overall device status page identifies devices by name without group affiliation You can use any alphanumeric characters in a device name. Notes - A field is provided for entering notes or comments for all devices.
4 • Set up Your System Architecture The communication path is written in the following syntax: \x or \x where ‘COM port ID’ is the physical COM port in the FactoryTalk EnergyMetrix server; ‘IP address’ is the IP address of a serial to Ethernet protocol converter (for example,. Digi-One IA); and ‘x’ is the Modbus node number of the device.
FactoryTalk EnergyMetrix Software AB_ETH-1\128.1.100.82\Backplane\2\A\10\Port2\6, path from the FactoryTalk EnergyMetrix server, via Ethernet to a ControlLogix Gateway with IP address 128.1.100.82, via ControlNet to a 1788-CN2DN bridge module, via DeviceNet to a Powermonitor 3000 with node address (MAC ID) 6 AB_ETH-1\128.1.100.
4 • Set up Your System Architecture Enter the OPC server name in the device setup screen. RSLinx Classic software must be activated at the OEM or higher level to support OPC. The update rate of OPC devices can be configured in the System Configuration page. OPC devices utilize the Max Messages setting in the device setup. There is no field for this on the device setup web page so it must be changed manually in the database. If the field in the database is null then it defaults to 10.
FactoryTalk EnergyMetrix Software Test Communication Button Visible only in view mode. Click this button to check the connection between FactoryTalk EnergyMetrix software and the device. When a new device is created, it may be necessary to click the button more than once to receive a ‘Connection successful’ response. In some cases it may be necessary to access the FactoryTalk EnergyMetrix server, open RSLinx Classic software, open RSWho, and drill down to the non-responding device.
4 • Set up Your System Architecture Delete a Device To delete a Device, follow these steps. Deleting a device also deletes all Meters associated with the device and purges all data associated with those meters in the FactoryTalk EnergyMetrix database. When a large quantity of data is purged, it is possible that a timeout error will occur in Microsoft SQL server, requiring a server restart. 1. Select the device you wish to delete in the System tab, Devices folder. 2.
FactoryTalk EnergyMetrix Software Set up a Meter A meter is a logical source of data to FactoryTalk EnergyMetrix software and is the unit used for licensing FactoryTalk EnergyMetrix Manager software. There are two types of meters. Device Meters are data sources that are associated with Devices. Tags associated with Device Meters are generally polled automatically Manual Meters are data sources that permit data to be entered manually.
4 • Set up Your System Architecture It is important to understand the difference between a Meter and a Device. A Device is a physical piece of hardware such as a power monitor or programmable controller, or a software application such as an OPC server. A Meter is a logical, or virtual, device that functions as a collection of data Tags. Three examples illustrating the importance of this distinction are: A power monitor is a single Device.
FactoryTalk EnergyMetrix Software 3. The Add a Meter dialog box appears. 4. Select a Parent Group. The default is the group selected when you began to configure the meter. 5. Select a meter Type from the pull-down menu. 6. Select a Device from the pull-down menu. If you need to, configure a new Device. 7. Enter a name for the new meter and any notes you wish to record. 8. Select a time zone for the meter. A new meter is automatically configured to contribute 100% of its value to its parent group. 9.
4 • Set up Your System Architecture 10. Click Save. To add meter tags, click the Add a new meter tag link. 11. Add meter tags and alarms as desired. 12. When finished adding meter tags, you can click the Read Device Tags link to view the value of the device tags. Set up a Manual Meter Manual meters allow the integration of data from non-automatic data sources such as legacy electric revenue meters, water meters, oil flow gauges and the like into the database and reports.
FactoryTalk EnergyMetrix Software Follow these steps to configure a manual meter. 1. Navigate to the group that will contain the manual meter. 2. Select the Meters tab. Click the Add a new meter link. 3. Select a meter type from the Type pull-down menu. Manual meters can be assigned any meter type. 4. Select None as the Device. 5. Enter a Name, any Notes and select a Time zone for the meter. 6. Click Save. 7. To add meter tags, click the Add a new meter tag link.
4 • Set up Your System Architecture Set up an OPC Meter OPC meters allow FactoryTalk EnergyMetrix to communicate with a wide variety of Rockwell Automation and third-party devices by using OPC. Starting with FactoryTalk EnergyMetrix software version 1.5, connection with the RSLinx Classic OPC server is supported in Manager. Connection to third party OPC servers such as Kepware requires installation of the FTEMOPC 3rd party communication option.
FactoryTalk EnergyMetrix Software Set up a Roll-up Server Meter Roll-up server functionality in FactoryTalk EnergyMetrix software supports transfer of meter data from a local FactoryTalk EnergyMetrix (or RSEnergyMetrix) server database to another. Typically a roll-up server is used in a corporate setting to consolidate and summarize local plant energy information. If you plan to use roll-up server meters, please install Internet Explorer WebControls 1.0 on the server.
4 • Set up Your System Architecture The Add a Meter dialog box appears. 3. Select a Parent Group. The default is the group selected when you began to configure the meter. 4. Select a meter Type from the pull-down menu. 5. Select a Device from the pull-down menu. 6. Enter a name for the new meter and any notes you wish to record. 7. Select a time zone for the meter. A new meter is automatically configured to contribute 100% of its value to its parent group. 8.
FactoryTalk EnergyMetrix Software Sharing a Meter Between Groups and Domains You can assign a meter to multiple groups, move a meter from one group to another, or apportion a meter among different groups or domains. Follow these steps to share a meter between groups and domains. 1. Navigate to one of the groups or domains that will share the meter. 2. In the Group Setup screen, click Edit. 3. Select the meter to share.
4 • Set up Your System Architecture Copy or Delete a Meter Meters can be deleted or copied by using the buttons in the Meter Setup screen. Copy a Meter Copying Meters can increase productivity during initial setup of FactoryTalk EnergyMetrix software or when adding power monitors to an existing system. To copy a Meter, follow these steps. To save time, create a master meter for each Device Class, create all the desired Meter Tags, verify logging and data correctness.
FactoryTalk EnergyMetrix Software The Cancel button will not delete the new meter, only cancel edits made in steps 6 thru 8. The new Meter copy will be assigned to the same Groups as the meter that was copied. To change the group assignment, use the meter assignment function in the System tab > Group Setup screen. Delete a Meter To delete a Meter, follow these steps. Deleting a Meter also deletes all Meter Tags and purges all data associated with the meter in the FactoryTalk EnergyMetrix database.
4 • Set up Your System Architecture Set up an Allen-Bradley Power Monitor Tag FactoryTalk EnergyMetrix software makes setup of Allen-Bradley power monitor tags easy and straightforward. Follow these steps to set up an Allen-Bradley power monitor tag. 1. In the Add a Meter Tag window, leave the Meter tag type as Device. 2. Select a tag from the Select device tag to load data pull-down menu. 3. Note that the remaining fields are automatically filled in.
FactoryTalk EnergyMetrix Software Do not change any of the remaining fields from the values that FactoryTalk EnergyMetrix software fills in automatically. Changing the address, data format, scaling, value type, and other parameters may prevent logging of the tag or may cause the tag to be logged with erroneous data. 4. Set the Log rate to the polling interval you desire. 5. Click Save to save the new tag, or Cancel to exit without saving.
4 • Set up Your System Architecture Set up a ControlLogix Meter Tag For meters attached to ControlLogix device types, FactoryTalk EnergyMetrix software communicates with PLC-5 or SLC 500 mapped tags in the ControlLogix controller. The user must perform the tag mapping and configure meters by using the mapped addresses. To communicate with ControlLogix native tags, use an OPC meter and the RSLinx Classic OPC server. To configure a ControlLogix tag, follow these steps. 1.
FactoryTalk EnergyMetrix Software Set up an OPC Meter Tag Ten meter licenses are included in Manager. These meters may be any combination of RSLinx and OPC meters. Beyond the first ten meters, in order to communicate with third party devices such as power monitors from other vendors, the FTEMOPC 3rd party Connectivity Option must be installed. Follow these steps to set up an OPC Meter Tag: 1. In the Add a Meter Tag window, leave the Meter tag type set to Device. 2. Enter a Name for the meter tag.
4 • Set up Your System Architecture 6. Click Save to create the new tag or Cancel to exit without saving. FactoryTalk EnergyMetrix software includes an OPC Test Client that can be used for verifying and troubleshooting logging from OPC servers. The OPC Test Client can be found on the server in the \bin folder under the FactoryTalk EnergyMetrix program folder. Set up a Manual Meter Tag Follow these step to configure a manual tag for a manual meter. 1.
FactoryTalk EnergyMetrix Software 4. Click Enter Data. 5. Enter a date and time in the date / time field and click Set to set a common time stamp for all the tags listed in the window. 6. Enter the desired data for each manual tag. Data will be scaled by the scale and offset parameters configured in the meter tag setup. 7. Click Save to store or Cancel to delete without saving. Set up a Roll-up Meter Tag Follow these steps to set up a roll-up meter tag: 1.
4 • Set up Your System Architecture A new window opens containing the navigation tree, meters and meter tags in the remote server. The objects accessible to you are determined by the username and password used in setting up the roll-up server device. 3. Drill down to and select a Meter Tag from the remote server. The new window remains open. Return to the meter tag setup screen. You can keep the name that is automatically entered or enter a different Name for the meter tag.
FactoryTalk EnergyMetrix Software 5. Once the meter tag has been saved, you can manually refresh tags from the remote server by entering a start date in the field provided, and clicking the Get roll-up tag values button. If custom value types have been added to a local FactoryTalk EnergyMetrix server, identical value types must exist in the rollup server to prevent roll-up data with an incorrect value type.
4 • Set up Your System Architecture 3. Set the Log rate to the polling interval you desire. The derived tag script will run at the polling interval specified. Derived tag scripts run five minutes after the normal polling time, so that all referenced meter tags have been updated. Derived tags that reference roll-up meter tags must have a log rate no less than the roll-up interval. Set the Log rate to 10,080 minutes (1 week) to process the derived tag at midnight on Sunday. 4.
FactoryTalk EnergyMetrix Software Usage is: CalcDerivedTags [-sd ] [-ed ] [-t ] [-d] -sd -ed if not specified, generates values until current date -t if not specified, generates all derived tags in the system -d delete old data in the selected interval before generating new values; if not specified, existing data is not overwritten Examples Simple derived tag In this example, the 'Acme' domain includes a main meter and a meter on
4 • Set up Your System Architecture Derived Tag Functions You can use functions similar to those used in Rate Schedules in Derived Tag scripts. Derived Tag functions are listed below. MeterTagId is the ID number of the selected meter tag and can be found in the meter setup screen. Except as otherwise noted, all function arguments are Integer values and all functions return a Double value.
FactoryTalk EnergyMetrix Software TagRatchet Function Returns the largest instance of the selected MeterTagId over the specified DateRange or time span and IntervalInMonths ending with the optional EndDate argument. The EndDate argument is a String type. If the EndDate is not specified, the IntervalInMonths ends on the current date and overlaps the specified DateRange or time span. Usage: Result = TagRatchet(MeterTagId, [EndDate,] IntervalInMonths, DateRange.
4 • Set up Your System Architecture GetTagData Function Returns the value of the most recent logged value of the selected MeterTagId, looking back from the current time (or the optional utcTimeStamp argument if specified) for a duration of one logging interval. The result is an Object variable which contains the tag value or Nothing if no tag value can be found. If data is found, the expression ‘Not GetTagData(argument) Is Nothing’ evaluates as True.
FactoryTalk EnergyMetrix Software Meter Tag Common Elements Whether a meter tag represents a power monitor parameter, a PLC data table address, an FactoryTalk EnergyMetrix server roll-up parameter, a manual data entry point, or an OPC item, meter tags share several common elements. Not all tag types use every element. Meter Tag Type Select from None, Device, Manual, Derived, or Alarm. When you select a tag type, the meter tag setup page will change to suit the tag type.
4 • Set up Your System Architecture Unit Applies a unit such as kWh, or kVARs to the meter tag. Automatically populated if a Value Type is selected. Otherwise you can select a unit from the pull-down menu. Number of Decimals to Display Applies to the meter data page. Scale and Offset Permits linear adjustment of the raw value (‘x’) before it is stored (as ‘y’) in the database. Scale is the ‘m’ and offset is the ‘b’ in the following equation: y = mx + b.
FactoryTalk EnergyMetrix Software Automatic Data Repopulation ADR, a standard Manager function, gathers selected data from device data logs to repopulate database gaps caused by network or server outages. ADR will not repopulate gaps in the database that are caused by loss of power to or failure of the metering devices. ADR periodically reads data logs from the device and, inserts records in the database where no corresponding data exists. It will not overwrite existing database records.
4 • Set up Your System Architecture Allen-Bradley Powermonitor II Unit Remote I/O, Ethernet and serial communication are supported. The Powermonitor II must be at firmware version 3.00 or later and set up to use either the 16 parameter or 3 and 7 parameter snapshot log. Snapshot log energy data is expressed with 7 digit precision while real-time energy data is expressed with 15 digit precision.
FactoryTalk EnergyMetrix Software Set up ADR for Programmable Controllers These steps are needed to set up automatic data repopulation from programmable controllers in FactoryTalk EnergyMetrix software. 1. Run the ADR Wizard to generate the RSLogix library import file. 2. Import the library file into the RSLogix ladder program for the controller. 3. Enable ADR on the controller Device in the Device Setup page. 4.
4 • Set up Your System Architecture Run the ADR Wizard Follow these steps to run the ADR wizard and import the library file into your ladder program. 1. Launch the wizard and click Next to proceed. 2. Select the processor type and enter the file name and path for the library file. 3. Click Next and configure the controller parameters.
FactoryTalk EnergyMetrix Software The default values of the fields should only be changed if required for the particular application. The log rate determines the sampling period in minutes and should correspond to the log rate of the meter tag in FactoryTalk EnergyMetrix software. Select file numbers that will not conflict with any existing files assigned in your controller. In this example, config file N99, interfact file F100, and queue files F101 to f199 will be created by the wizard.
4 • Set up Your System Architecture 5. Click Next to review the selections, then click Finish. For controller types CompactLogix and ControlLogix, the output file will have the file name you specified with a .L5K extension and a controller type of 1756L63. L5K files are complete ladder files rather than library files. For controller type of MicroLogix or SLC 500, the ADR wizard creates a set of output files: .SLC, .SY5 and .
FactoryTalk EnergyMetrix Software Enable ADR in the Device Setup Page During device setup in FactoryTalk EnergyMetrix software, enable ADR by selecting the check box. Enter the address of the ADR interface file. The default is 100. If you have changed the address of the ADR interface file in the ADR Wizard, enter the correct address.
CHAPTER 5 Visualize Energy Usage When you first select a Meter, the Meter Data tab is selected. This screen allows you to view the logged meter data. The display is arranged by log rate. The user time zone is selected by default. Controls allow you to select the desired date, scroll up and down through the data, and page backward and forward through the meter data. When you select a Group under the Meters tab, an aggregated view of the data of the meters in the group is shown.
FactoryTalk EnergyMetrix Software View a Trend Chart Follow these steps to view a Trend chart. 1. Navigate to and select a Group or Meter in the Meters tab of the navigation tree. 2. Select the Trend tab in the detail pane. 3. A blank chart appears labeled ‘No meter tags selected’. 4. If desired, select a time zone for the chart. The default is the logged-in user time zone. 5. Select a meter tag to display from the pull-down menu. 6. Select a start and end date for the trend by using the calendars.
5 • Visualize Energy Usage 5. Click the forward and backward buttons to display the next and previous months respectively. 6. Use scroll bars as needed to view the entire calendar display. To zoom-in, click on a day in the calendar. You can select up to five days by clicking on each one at a time. 7. To save the trend chart's data series as a .CSV file, click Export Data. Set up a Report Follow these steps to set up a report. 1. Navigate to the Reports tab in the navigation tree. 2.
FactoryTalk EnergyMetrix Software Viewing, Printing and Saving Report Output 1. Navigate to and select a report. 2. Select a report output type. Default is pdf. 3. Select a report time zone from the pull-down menu. Most reports default to the server local time zone. Reports based on a rate schedule default to the rate schedule's time zone. 4. Enter a predefined or custom report time span. The default report time span is the previous calendar month.
5 • Visualize Energy Usage Copying an Existing Report Click Copy on a report setup screen to make a copy of the report. The copy will be identical except for the name with will be ‘Copy of ’. Run Reports Automatically Auto-run Report Jobs lets you schedule a report to run automatically. Report jobs are set up for individual reports. The report job setup is accessed from the report setup screen.
FactoryTalk EnergyMetrix Software Report Job Options These are the job options available. Enabled Check Box Check to enable the report job, leave unchecked to disable. Name Enter a name for the report job. Notes Enter any additional information you wish in the Notes field. Time Zone Enter the time zone in which the report job is to run. Email Addresses (optional) Enter one email address per line if you want to automatically run and email reports on a schedule.
5 • Visualize Energy Usage Viewing Automatically Generated Reports You can view reports that have been generated and that you have privileges to view by clicking the View generated reports link in the Reports tab. Clicking the name of a report opens the selected report in a new browser window. Clicking a list header (such as Name, Domain Name, or TimestampUTC sorts the list by the parameter selected. The sort order is indicated by an arrow. Click the header again to reverse the sort order.
FactoryTalk EnergyMetrix Software Set up a Billing Rate Schedule Rate schedules define the content and format of billing reports.
5 • Visualize Energy Usage Rate Schedule Options The Rate Schedule options include exporting, importing, and printing files. Export Button Lets you export a rate schedule to an xml file. Import Button Lets you import a rate schedule xml file.
FactoryTalk EnergyMetrix Software Enter Rate Schedule Information Select the System tab in the navigation tree, then open the Rate schedules folder. Select the Global rate schedules folder or one of the domains listed in the Rate schedules folder. Click the Add a rate schedule link. The tabbed Add a rate schedule screen appears in the detail pane. Enter general information about the rate schedule under the Information tab. Enter information in the fields: Select a Domain.
5 • Visualize Energy Usage Runtime Parameters If you want to, set up one or more Runtime Parameters. Use a runtime parameter to enter parameters that are not logged automatically but are needed in the report calculations. For example, your gas bill may include a BTU factor per hundred cubic feet that changes from month to month. Line item scripts operate on runtime parameters by using the name you assign at set-up time, but with spaces omitted.
FactoryTalk EnergyMetrix Software The default number of seasons in a rate schedule is zero. You must create and assign names, start dates and end dates for seasons. A season begins at 12:00 am on the Start Day in the Start Month and ends at 12:00 am on the End Day of the End Month. Seasons repeat each year for the effective duration of the rate schedule (between the rate schedule's Start Date and End Date). How to Enter a Season Click the Add a season link to create a new season.
5 • Visualize Energy Usage Assigning Holidays You can create an unlimited number of holidays. You can specify holidays By Date or By Day. Select By Date for holidays that repeat on the same date (or do not repeat). Enter a fixed date in the format mm/dd/yyyy and a description. Leave the Year field blank for holidays that repeat each year, such as Christmas and New Years Day.
FactoryTalk EnergyMetrix Software The times of use can be referenced in scripts by name excluding all blank space characters. For example, if you specify time of use named ‘Off Peak’, it should be referenced in scripts as TimeOfUseType.OffPeak. In Peak, Average, and Min functions the calculation interval includes the time of use end point but does not include the start point.
5 • Visualize Energy Usage You can arrange line items on a billing report subdivided by groups such as ‘Energy charges’, ‘Demand charges’, or ‘Facility charges’. If no group names are entered then the billing report will not be subdivided. If group names are used, then the billing report will be subdivided into as many groups as there are unique group names. 3. Enter an optional Start Date and End Date for the line item.
FactoryTalk EnergyMetrix Software Line Item Scripting The billing report executes rate schedule line item scripts at report runtime. The scripts define the quantities, units and charges shown in the billing report. Save your script frequently. When you save a script, a validation is performed and if errors exist the script will not be saved. To save a script you must correct any script errors or temporarily convert the offending script element to a remark.
5 • Visualize Energy Usage You can also declare local or global variables (or constants) by using the Dim (or Const) statement. Use the following syntax: Dim MyVariable [As ] [= ] Const MyVariable [As ] = You may use local variables to structure and simplify scripts that represent complex charges. Local variables do not appear in the report output but can be used to calculate Quantity, Unit, Charge, or Visible. Declare local variables in each line item script.
FactoryTalk EnergyMetrix Software Scripting Function Description SeasonDayCount Function Returns the number of days in the billing period that are in the specified season SetDateRange Function Used to obtain reports that compare usage over two different reporting periods Sum Function Calculates the arithmetic sum of a non-cumulative tag Total Function Calculates consumption of a consumption tag such as energy TotalRTPCharge Function Calculates the total charge for a consumption tag such as kWh, by
5 • Visualize Energy Usage Band Function The Band function provides a shortcut for calculating ‘banded’ charges (see the Example). This function comprises the following script code: If (Val > Max) Then Result = Max - Min Else If (Value > Min) Then Result = Val - Min Else Result = 0 It returns a Double value. Usage Quantity = Band(val, min, [max]) Comments Variables Val, Min, and Max may be constants or expressions that return a Double value. Max is optional. Example In this example, a utility charges 7.
FactoryTalk EnergyMetrix Software Comments The value selected is the last value logged within one logging interval before the Report Start Date or the specified Time Stamp. It returns an Object value. The time stamp may be expressed in a few different formats, for example ‘1/30/2003 12:30 PM’ or ‘2/28/1999’. The most reliable method is to use the .
5 • Visualize Energy Usage Report output: Lowest Function The Lowest function returns the minimum of the selected value logged between the report start and end dates, and during the periods defined by the SeasonType, DayType, and TimeOfUseType (or StartHour and EndHour) arguments. The Lowest function is generally used for rate-of-change values such as demand real and reactive power (kW, kVAR). It returns a Double value. Usage Quantity = Lowest(ValueType.enumValue) Quantity = Lowest(ValueType.
FactoryTalk EnergyMetrix Software Usage Quantity = LowestTimestamp(ValueType.enumValue) Quantity = LowestTimestamp(ValueType.enumValue, SeasonType.enumValue) Quantity = LowestTimestamp(ValueType.enumValue, SeasonType.enumValue, DayType.enumValue) Quantity = LowestTimestamp(ValueType.enumValue, DayType.enumValue) Quantity = LowestTimestamp(ValueType.enumValue, startHour, endHour) Quantity = LowestTimestamp(ValueType.enumValue, TimeOfUseType.enumValue) Quantity = LowestTimestamp(ValueType.
5 • Visualize Energy Usage Quantity = NLowest(ValueType.enumValue, SeasonType.enumValue, DayType.enumValue, TimeOfUseType.enumValue, N) Quantity = NLowest(ValueType.enumValue, DayType.enumValue, TimeOfUseType.enumValue, N) Comments N is an integer representing the number of minimum values to be returned. The startHour and endHour arguments are integers in the range of 1…24, where 24 = midnight.
FactoryTalk EnergyMetrix Software Example The following script returns the time stamp of the real demand power minimum that occurred during the Summer season, on working days, during the hours of 10:00 a.m. to 4:00 p.m.: dim dtMins(3) [as DateTime] dtMins = NLowestTimestamps(ValueType.RealPowerDemand, SeasonType.Summer, DayType.
5 • Visualize Energy Usage NPeakTimestamps Function The NPeakTimestamps function returns the time and date that the N largest instances of the selected value was logged between the report start and end dates, and during the periods defined by the SeasonType, DayType, TimeOfUseType (or StartHour and EndHour) arguments. The NPeakTimestamps function is generally used for rate-ofchange values such as demand real and reactive power (kW, kVAR). It returns an array of N DateTime values.
FactoryTalk EnergyMetrix Software Peak Function The Peak function returns the maximum of the selected value logged between the report start and end dates, and during the periods defined by the SeasonType, DayType, TimeOfUseType (or StartHour and EndHour) arguments. The Peak function is generally used for rate-of-change values such as demand real and reactive power (kW, kVAR). It returns a Double value. Usage Quantity = Peak(ValueType.enumValue) Quantity = Peak(ValueType.enumValue, SeasonType.
5 • Visualize Energy Usage Usage Quantity = PeakTimestamp(ValueType.enumValue) Quantity = PeakTimestamp(ValueType.enumValue, SeasonType.enumValue) Quantity = PeakTimestamp(ValueType.enumValue, SeasonType.enumValue, DayType.enumValue) Quantity = PeakTimestamp(ValueType.enumValue, DayType.enumValue) Quantity = PeakTimestamp(ValueType.enumValue, startHour, endHour) Quantity = PeakTimestamp(ValueType.enumValue, TimeOfUseType.enumValue) Quantity = PeakTimestamp(ValueType.enumValue, SeasonType.
FactoryTalk EnergyMetrix Software Example The following example assigns a proration factor as a global variable for Demand charges if the billing report period is less than or greater than a month.
5 • Visualize Energy Usage Comments Use the Ratchet function to calculate a demand penalty, in which a charge is based on the peak demand in the previous six months, year or other period. For calculating peaks which occur within the report period, use the Peak Function. The endDate argument is optional. The function defaults to the report end date. If used, endDate is a string in the format mm/dd/yyyy [hh:mm [am/pm]]. The best way to express the date is to use the .
FactoryTalk EnergyMetrix Software SetDateRange Function The SetDateRange function changes the calculation start and end dates with respect to the Report End Date. It operates only on the current line item. SetDateRange returns no value. This function can be used to generate reports that compare current usage with historical usage or to accommodate billing charges that apply for a certain number of hours in each billing period. Usage SetDateRange(DateOffset.
5 • Visualize Energy Usage Sum Function The Sum function calculates the arithmetic sum of logged non-cumulative (delta-logged) consumption or production values over the report period or other period defined by the function arguments. It returns a Double value. Usage Quantity = Sum(ValueType.enumValue) Quantity = Sum(ValueType.enumValue, intervalInMonths) Quantity = Sum(ValueType.enumValue, endDate, intervalInMonths) Quantity = Sum(ValueType.enumValue, SeasonType.enumValue) Quantity = Sum(ValueType.
FactoryTalk EnergyMetrix Software Total Function The Total function returns the accumulated usage of the selected value logged between the report start and end dates, and during the periods defined by the SeasonType, DayType, and TimeOfUseType (or StartHour and EndHour) arguments. The Total function is generally used for values such as energy (kWh, kVARh, gallons of oil) and production units. It returns a Double value. Usage Quantity = Total(ValueType.enumValue) Quantity = Total(ValueType.
5 • Visualize Energy Usage Usage Charge = TotalRTPCharge(ValueType.enumValue, priceMeterTagPath) Charge = TotalRTPCharge(ValueType.enumValue, SeasonType.enumValue, priceMeterTagPath) Charge = TotalRTPCharge(ValueType.enumValue, SeasonType.enumValue, DayType.enumValue, priceMeterTagPath) Charge = TotalRTPCharge(ValueType.enumValue, DayType.enumValue, priceMeterTagPath) Charge = TotalRTPCharge(ValueType.enumValue, startHour, endHour, priceMeterTagPath) Charge = TotalRTPCharge(ValueType.enumValue, SeasonType.
FactoryTalk EnergyMetrix Software Enumeration Values for Functions Enumeration values are named constants for use in functions. Accepted enumeration values are listed below. ValueType RealEnergyNet RealEnergyExported RealEnergyImported ReactiveEnergyNet ReactiveEnergyExported ReactiveEnergyImported RealPowerDemand ReactivePowerDemand ApparentPowerDemand ValueType enumeration values correspond to entries in the ValueTypes table in the database.
5 • Visualize Energy Usage SeasonType Enumeration values correspond to user-defined season names but with spaces omitted. For instance, a user-defined season named ‘First Quarter’ corresponds to an enumeration value of FirstQuarter. TimeOfUseType Enumeration values correspond to user defined time-of-use period names but with spaces omitted. For instance, a user-defined time-of-use period named ‘Off Peak Summer’ corresponds to an enumeration value of OffPeakSummer.
FactoryTalk EnergyMetrix Software Sales tax MONTHLY RATE Energy Charge 1. On-Peak a. Winter (Calendar Months Oct-May): $.03594/Kwh 7AM-10PM Mon - Fri (Except Holidays) b. Summer (Calendar Months Jun-Sep): $.03594/Kwh 7AM-11PM Mon - Fri (Except Holidays) 2. Off-Peak a. Winter (Calendar Months Oct-May): $.01558/Kwh 10PM-7AM Mon - Fri, all day Sat., Sun., and Holidays. b. Summer (Calendar Months Jun-Sep): $.01558/Kwh 11PM-7AM Mon - Fri, all day Sat., Sun., and Holidays. Demand Charge 1.
5 • Visualize Energy Usage Seasons The seasons in the sample tariff are easily entered into the rate schedule seasons tab. Holidays The holidays tab to the WPS Cp-1 tariff is shown below. Only Good Friday must be entered each year. Sample Time-of-use Energy Charge Script A sample script that implements the time-of-use metering specified in the sample tariff is shown below. Note that it implements different time-of-use schedules for summer and winter.
FactoryTalk EnergyMetrix Software The script configuration screen: And the actual line-item script: Rem On-peak energy charge EnergyUsageOnPeak = Total(ValueType.RealEnergyNet, SeasonType.Winter, DayType.WorkingDay, TimeOfUseType.EnergyOnPeakWinter) + _ Total(ValueType.RealEnergyNet, SeasonType.Summer, DayType.WorkingDay, TimeOfUseType.EnergyOnPeakSummer) Unit = GetUnit(ValueType.
5 • Visualize Energy Usage Times of Use The Demand scripts use the Demand Times of Use definitions. Line Items Generation System Demand Calcs The first line item calculates the various peak demand values listed in the rate tariff. The results of the calculations in this line item are assigned to Global variables.
FactoryTalk EnergyMetrix Software DemandGenSysInterSummer = Peak(ValueType.RealPowerDemand, SeasonType.Summer, DayType.WorkingDay, TimeOfUseType.DemandInterAMSummer) TestQty = Peak(ValueType.RealPowerDemand, SeasonType.Summer, DayType.WorkingDay, TimeOfUseType.
5 • Visualize Energy Usage If TestCharge > Charge Then Charge = TestCharge Quantity = TestQty RatePerUnit = 3.63 End If End Select Charge = ProRateMonthlyCharge(Charge) If Charge = 0 then Visible = False Transmission Demand This line item uses global variables assigned in the first line item above, determines the largest demand variable, assigns the rate per kw and prorates the charge. Dim TestQty Unit = GetUnit(ValueType.
FactoryTalk EnergyMetrix Software Fixed Charges The sample tariff includes a fixed monthly charge for the metering equipment installed at the customer site. The charge is prorated to apply the appropriate fraction is the report period is less than a month. Taxes and Fees The TotalCharges variable is used to calculate sales and use tax or other charges that are based on the total dollar amount of preceding line items.
5 • Visualize Energy Usage To set up a new alarm, navigate to the selected Meter Setup page and click the Add a new alarm link at the bottom of the page. The Alarm Setup page appears. Setup Parameters Alarm Information Enabled checkbox - click to enable or disable alarm. Alarm Name - alphanumeric name for the alarm, displayed in the Active Alarms and Alarm Summary pages. Meter Tag - select the meter tag to evaluate for alarm condition.
FactoryTalk EnergyMetrix Software Trigger Settings Analog / digital selection - determines which set of trigger settings apply to the alarm. Analog selection is disabled if the meter tag is a power monitor alarm flag. High / low threshold - set the upper and lower bounds of the alarm range. Either the high threshold, the low threshold, or both can be selected depending on the nature of the alarm.
5 • Visualize Energy Usage 4. In the Add Alarm Subscription screen, select the group or domain you wish to subscribe to (or 'none' for all domains), and enter up to three email addresses. 5. Click the Add new notification period link to set up schedules when each email address is active. 6. Select a day or day range from the pull-down menu. 7. Enter start and end times for each notification period. To set up a notification period of ‘all day’, leave all times with a value of zero.
FactoryTalk EnergyMetrix Software The Alarm Log tab lists the alarm history. Each alarm can be individually viewed or purged by clicking the appropriate link. The Purge All button clears all alarms form the database. Viewing Alarm Setups for All Alarms Select the Alarm Setup link from the System tab. The alarm setups page provides a summary list of all the alarms configured in the system. The list can be sorted by severity, name, meter tag name or meter name by clicking the underlined links.
CHAPTER 6 How to Set up a Personalized Start Page My Start Page lets you set up a tabbed initial FactoryTalk EnergyMetrix view with tabs and links that let you navigate to your favorite graphs, reports, meters, and custom pages with one or two mouse clicks. A default start page appears until you configure your start page. To begin, click the Configure My Start Page link. After My Start Page has been configured, it will be displayed each time the user logs in subsequently.
FactoryTalk EnergyMetrix Software Other links Collapse All: Collapses all the nodes to parent nodes Expand All: Expands all the nodes of the tree Check All: Selects all the check boxes in the tree Uncheck All: De-selects all the check boxes in the tree You can select any content for the reports, meters, and similarly custom pages for which you have privileges. Click Save to record your selections and view your newly-configured My Start Page.
6 • How to Set up a Personalized Start Page My Start Page Meters Tab When you select the Meters tab in My Start Page, a list of meters is displayed with various options. Options These are the various options on the Meters tab. List All Meters/List My Selected Meters Link Toggles between displaying only those meters selected during My Start Page configuration and all meters that you have privileges to access.
FactoryTalk EnergyMetrix Software My Start Page Reports Tab When My Start Page first appears, the Reports tab is selected. Report Date Range These selections allow you to select the default date range for the reports listed in My Selected Reports. You can choose from the list of pre-defined time periods or you can specify your own custom dates and times. My Selected Reports Lists the reports you selected when you configured My Start Page.
CHAPTER 7 RT (Real Time) Use FactoryTalk EnergyMetrix RT (RealTime) to configure Allen-Bradley power monitors and display their real-time data and power quality information. RT is a Click Once software application installed with FactoryTalk EnergyMetrix software that requires a separate activation. Once activated, RT device configuration and device viewer links become operational from device setup pages and the RT device viewer links becomes operational meter pages.
FactoryTalk EnergyMetrix Software Your client workstation must also be permitted Intranet, Internet, or dial-in access to the FactoryTalk EnergyMetrix server. Contact your IT support personnel for assistance. Your browser should be set to check for newer versions of stored pages automatically, not every visit to the page.
7 • RT (Real Time) PowerMonitor 5000 Device Viewer Window To launch the device viewer for a meter, select a meter in the navigation tree meters tab, and click the ‘Device class: Powermonitor 5000 (M5)’ link in the meter summary screen in the detail pane. The Device Viewer link also appears in the Device setup screen. The window title bar displays the device name of the power monitor. Click Pause to pause updating.
FactoryTalk EnergyMetrix Software Setpoint Output Status This displays setpoint output configuration and stats from an Allen-Bradley 1426 PowerMonitor 5000 unit. Input Source - The input source to trigger the output Output Action - The action for the output Status - The current value for the Output - True or False Waveform Tab This displays captured oscillographs from an Allen-Bradley 1426 PowerMonitor 5000 M6 or M8.
7 • RT (Real Time) Waveform Files Tab In the Waveform Files tab, the individual waveform files to view can be selected in the drop down list. The waveform files are identified by trigger, date, capture number, size, etc. Once a waveform file is selected and the Display button is pressed, the viewer will start to load the waveform file and show the progress in the status bar of the dialog box.
FactoryTalk EnergyMetrix Software Fields Date/Time of waveform This displays date and time when the waveform was captured. Total cycles This displays the number of cycles captured. Shoe Channel This shows which channels are displayed and allows for selection of channels to display. Show Markers This shows for each channel if markers are shown and allows for selection of channels to display markers for.
7 • RT (Real Time) This shows the phase rotation of the voltage. If the power monitor is measuring a single-phase system, this field will display ‘No Rotation’. Voltage and Current Sequence Components This shows the results of symmetrical component analysis and the voltage and current unbalance values. Power Tab This displays real-time data from an Allen-Bradley 1426 PowerMonitor 5000 unit.
FactoryTalk EnergyMetrix Software The calculated demand for total apparent power. The demand values are displayed for the most recent complete demand interval. Projection Data The calculated projected values for current, power, reactive power and apparent power. Input/Output Tab This displays real-time data from an Allen-Bradley PowerMonitor 5000 Unit. Status Inputs This shows the current state of the configured status inputs.
7 • RT (Real Time) Harmonics Tab This displays harmonics summary data from an Allen-Bradley PowerMonitor 5000. Total Harmonic Distortion Data This displays the total harmonic distortion on the selected channel calculated by using IEEE and IEC methods for determining THD. The Bulletin 1426 M6 model also displays the following: Buttons Harmonics Channels Check Boxes This selects the harmonic channel to display.
FactoryTalk EnergyMetrix Software Min/Max tab This displays the Min/Max log from the power monitor. Maximum and minimum values are maintained since the last time the log was reset. Time-of-Use tab This displays the time of use records from the TOU log in the power monitor. Load Factor Log Tab (M6 and M8 only) This displays the load factor log from the power monitor, including load factor results for real power, reactive power, apparent power, and current for the current and previous 12 months.
7 • RT (Real Time) Clear Button This clears the log you select from the pull-down menu (Data, Energy, Min/Max, or Setpoint) from the power monitor. Alarms Tab This displays the contents of the alarms stored in an Allen-Bradley 1426 PowerMonitor 5000 unit. Radio Selection Selection between showing only alarms or all alarms. Columns The alarm table description as well as the status of the alarms.
FactoryTalk EnergyMetrix Software Runtime status Displays firmware revisions and operating data about the hardware and firmware assemblies in the power monitor. Communication status Displays communication status from the device. IEEE 1588 status Displays the IEEE 1588 (Precision Time Protocol) information and status about the device. Perform Test Button Click this button to initiate wiring diagnostics. Wiring diagnostics results are updated for five minutes after a command is issued.
7 • RT (Real Time) Voltage / current input missing The voltage and current input missing results point to errors in wiring the voltage and current inputs. ‘Missing’ means that the indicated inputs have not been wired to the voltage or current terminals.
FactoryTalk EnergyMetrix Software 4. Change configuration data in any of the tabs, as appropriate, or upload the configuration from the power monitor. 5. Click Download to download the new settings to the power monitor. 6. Click Close to close the Device Configuration window. To prevent downloading a default configuration to a previously-configured power monitor, you should always upload first, then make any changes desired, then download. Downloading is password protected.
7 • RT (Real Time) PowerMonitor 5000 Device Configuration Window To launch the device configuration window, select a power monitor device in the navigation tree System tab, and click the Device Configuration link in the device setup screen in the detail pane. The window title bar displays the device name of the power monitor. Set up groups and power monitor devices before using RT to modify the power monitor configuration.
FactoryTalk EnergyMetrix Software Download Button This downloads configuration settings from the database to the power monitor. After downloading, click OK to save the configuration and close the Device Configuration window. Voltage/Current Tab This displays and sets operating parameters, including wiring mode, and current and voltage scaling (PT and CT ratios), for an Allen-Bradley PowerMonitor 5000 unit.
7 • RT (Real Time) Demand/IO Tab This displays and sets demand parameters, output control parameters and status input counter input scaling factors for an Allen-Bradley PowerMonitor 5000 unit. Period length (minutes) Enter the length of the demand period: 1…99. The power monitor internal clock measures the period for both the actual and the projected demand values. 0. Disables projected demand. If Demand source is set to 0, internal time, disables demand calculation.
FactoryTalk EnergyMetrix Software Load factor log auto reset/clear day Automatically stores the current peak, average and load factor results as a record in the non-volatile load factor log and clears the peak and average demand values at the end of the specified day of each month. If this parameter is set to 29…31 and the month does not contain that many days, the record will be saved on the last day of that month. The parameter can also be set to Disable.
7 • RT (Real Time) Evaluation type. Magnitude (analog) or state (discrete). Threshold. This is the value at which to trigger a setpoint action. Hysteresis. This is the dead-band around the threshold. Assert Delay. This is the amount of time to wait before triggering a setpoint action after satisfying the setpoint test condition. De-assert Delay. This is the amount of time to wait before releasing a setpoint action after a setpoint condition is no longer satisfied.
FactoryTalk EnergyMetrix Software Logs Tab This sets various options for the Allen-Bradley 1426 PowerMonitor 5000 unit trend log, minimum/maximum log, and event log. Data, Trigger, and Energy Logging Interval Defines the interval for the data and energy logs. If you check Sync to demand interval, the values for minutes [and seconds] are ignored. Minutes. 0…60 Seconds.
7 • RT (Real Time) Save status changes to event log Select this check box to write input activity to the event log. Clear the check box to NOT record input activity. DST Tab PowerMonitor 5000 units can be configured to automatically adjust for daylight savings time. DST is disabled by default. Enable Daylight Saving Time Enables the daylight saving time function. Range 0 = disable, 1 = enable When Daylight Saving Time Starts Start hour Selects the hour of the day when DST begins.
FactoryTalk EnergyMetrix Software Configured the same as the start parameters above. DST is disabled by default. When enabled, the default start time is 2:00 a.m. on the second Sunday in March, and the default end time is 2:00 a.m. on the first Sunday in November. TOU Tab This tab lets you set up a custom time-of-use (TOU) profile in the Allen-Bradley PowerMonitor 5000 unit for logging energy and demand into the TOU log. Off-peak days Select days that are defined as off-peak.
7 • RT (Real Time) PowerMonitor 1000 Diagnostics Tab This tab displays diagnostics information about the PowerMonitor 1000 unit, including: Model Base and analog (if present) firmware revisions Serial number Date and time Diagnostics tab This tab displays diagnostics information about the power monitor, including: Model Base and analog (if present) firmware revisions Serial number Date and time Wireless PowerMonitor W250 Diagnostics This diagnostics tab provides information about the W
FactoryTalk EnergyMetrix Software Diagnostics Tab This tab displays diagnostic information about the 1403 Powermonitor I unit, including Model Base and analog (if present) firmware revisions Serial number Date and time Device Classes FactoryTalk EnergyMetrix uses Device Classes to determine how to interact with a particular device. The device class includes the device family, communications type and whether the device has a clock that can be synchronized.
7 • RT (Real Time) units may connect to the FactoryTalk EnergyMetrix server using serial multidrop (RS-485) or Ethernet communications (using a serial to Ethernet gateway). If the PowerMonitor 500 is configured for data logging via EtherNet/IP, and the configuration is uploaded or downloaded then EtherNet/IP communication may be disrupted for a minute or so, while the configuration activity is executing. Wireless PowerMonitor W250 Connects to an Allen-Bradley PowerMonitor W250.
FactoryTalk EnergyMetrix Software An important use for OPC meters is to log data from Allen-Bradley Logix family controller native tags using the RSLinx Classic OPC server. To support OPC, RSLinx Classic must be activated at the OEM level or higher, e.g., Professional, Gateway, etc. FactoryTalk Live Data Server on Ethernet Connects to the FactoryTalk Live Data Server (RSLinx Enterprise). The OPC Browser may be used for setting up Devices, Meters and Meter tags.
7 • RT (Real Time) Serial - DF1 full-duplex DH+ - Data Highway Plus 181
FactoryTalk EnergyMetrix Software ControlLogix on (comm. type) Connects to an Allen-Bradley ControlLogix (or Logix family) controller, such as CompactLogix. With this device class FactoryTalk EnergyMetrix may log only PLC/ SLC mapped tags. You may log Logix family native tags using RSLinx Classic OPC. ControlNet Ethernet - EtherNet/IP Serial - DF1 full duplex DH+ - Data Highway Plus PLC-5 on (comm. type) Connects to an Allen-Bradley PLC-5 programmable controller.
7 • RT (Real Time) SLC 500 MicroLogix ControlLogix Upload Configuration from a Power Monitor Uploading takes the configuration contained within the power monitor and places it in the database. An upload is typically performed when connecting to an existing power monitor system for the first time. To Upload a Power Monitor Configuration 1. Select a power monitor device in the navigation tree System tab, and click Device Configuration in the device setup screen in the detail pane. 2. Click Upload. 3.
FactoryTalk EnergyMetrix Software 184 Over forward setpoints Over reverse setpoints Under setpoints Under forward setpoints Under reverse setpoints Equal setpoints Not equal setpoints
7 • RT (Real Time) Notes: 185
FactoryTalk EnergyMetrix Software 186
CHAPTER 8 ChartsPlus ChartsPlus ChartsPlus is an optional package that offers extensive custom charting capabilities. ChartsPlus is a Microsoft ClickOnce application that downloads and runs on the client computer. Its look and feel is that of a traditional Windows application rather than a web application. ChartsPlus is included in FactoryTalk EnergyMetrix software and requires a separate activation. ChartsPlus provides you with the ability to create customized graphical views of your energy data.
FactoryTalk EnergyMetrix Software Client Requirements Client requirements for compatibility with FactoryTalk EnergyMetrix: Microsoft Windows XP Professional, Vista Professional, Windows 7 (Windows 2000 is not supported). Internet Explorer 7, 8, 9, or 10. Adobe Acrobat Reader 7.0 or later is required to view reports. Microsoft .NET Framework 3.5 SP1 is required to use RT and Charts Plus options. .NET Framework 3.
8 • ChartsPlus Create a New Chart Follow these steps to create a new chart in ChartsPlus. 1. Select New Chart from the File menu. 2. Select a chart type from the menu. 3. Configure the chart options to your preferences. 4. If desired, save the chart by using the File > Save Chart menu. Set up a ChartsPlus Trend Chart ChartsPlus provides a number of options for customizing trend charts. When you select Trend Chart from the File > New Chart menu, the setup window appears.
FactoryTalk EnergyMetrix Software Group Button Select the group of which the desired meter is a member. View Data Button Select By meters to view an individual meter. Select By groups to aggregate a group's meters into a single trend line. Meter Button Select the desired meter from the pull-down menu. This field is disabled (grayed-out) if By groups is selected. Meter Tag Button Select the meter tag from the pull-down menu. Start Date Button Select a start date from the calendar.
8 • ChartsPlus D Click this button to set all pens to the same starting date as the selected pen. Set up an Overlay Chart An overlay chart graphically displays a selected meter tag value with one or more userdefined overlays. Up to 10 overlays can be defined, each with a start time, end time and limit. Overlay periods are saved with the chart setup in the database. Time Zone field Sets the time zone reference for the trend chart.
FactoryTalk EnergyMetrix Software 192 Group Select the group of which the desired meter is a member. View Data Select By meters to view an individual meter. Select By groups to aggregate a group's meters into a single trend line. Meter Select the desired meter from the pull-down menu. This field is disabled (grayedout) if By groups is selected. Meter Tag Select the meter tag from the pull-down menu.
8 • ChartsPlus Limit The value of the horizontal bar drawn on the chart between the start and end times. Cannot be zero. Add button Enabled when the dialog box first appears. Click after entering time and limit values to add the new period. Cancel button Cancels changes to the selected period configuration without saving Save button Saves changes to the selected existing period. Delete button Deletes the selected period.
FactoryTalk EnergyMetrix Software Toolbars There is a standard toolbar and an annotation toolbar available. Standard Toolbar The standard toolbar contains buttons that provide you with a wide assortment of formatting options. Copy button lets you copy the chart as a graphic (bitmap or metafile) or as data (.csv format) Print button calls up the system print dialog box Gallery button allows you to select from chart appearance options.
8 • ChartsPlus Annotation Toolbar The annotation toolbar contains buttons that let you add notes and highlights to your chart.
FactoryTalk EnergyMetrix Software Properties Dialog Box You can call up the Properties dialog box by clicking the Properties button in the standard toolbar or from a context menu. The properties dialog box contains a variety of formatting selections organized in three tabs. Many options are the same as those available in the standard toolbar. The general tab lets you control the colors, axis and data series effects, and 3D view.
8 • ChartsPlus Context (right mouse-click) Menus You will find a number of context menus that appear when you position the cursor over the chart background, a chart line or other object in the ChartsPlus window and click the right (non-primary) mouse button. Each context menu contains a list of formatting options for the object selected and allows you to select the Properties dialog box.
FactoryTalk EnergyMetrix Software How to use X-Y Charting and Targeting The X-Y Trend Chart provides graphical tools to help you analyze energy usage and identify areas for reducing cost. Overview of X-Y Trend, Targeting, and CUSUM Analysis The X-Y chart plots one dependent (Y) variable against up to 3 independent (X) variables. It performs statistical analysis methods including linear regression, targeting, and CUSUM (cumulative sum) analysis. The X-Y trend chart is included in the ChartsPlus option.
8 • ChartsPlus Regression Analysis ChartsPlus displays the standard regression line as a black line on the X-Y trend chart. The regression line (known as the least squares line) is a plot of the expected value of the dependent variable for all values of the independent variable. The regression line is the one that best fits the data on a scatter plot. A linear regression on X-Y chart is calculated by using the least squares method.
FactoryTalk EnergyMetrix Software You can save the current target by clicking the Save Target button on the Targeting tab. You can also view and delete saved targets by clicking the Target Manager button. Saved targets can be accessed in Multi-purpose Report scripts (included in the ReportsPlus option) by using the TargetTotal method of the Meter and Group objects.
8 • ChartsPlus Time Zone Field Sets the time zone reference for the trend chart. Data from meters outside the selected time zone will be offset by the time zone difference. Start Date and End Date Field Select a chart time scale by entering start and end dates into the field. You can also select start and end dates from a calendar by clicking the down arrow button next to the field. Include Zero on Y Axis Check this box if you wish to have a zero reference on the chart.
FactoryTalk EnergyMetrix Software Use Targeting To use targeting, first set up an X-Y trend chart then select the Targeting tab.
8 • ChartsPlus Save Target Button Brings up the Target Manager dialog box that allows you to save the current target. Saved targets can be accessed in Multi-purpose Report scripts (included in the ReportsPlus option) by using the TargetTotal method of the Meter and Group objects. b, m1, m2, m3, R Data entry fields that allow you to edit the coefficients prior to saving the target.
FactoryTalk EnergyMetrix Software Use the CUSUM Chart Once you have set up an X-Y trend chart and targeting, the CUSUM chart provides additional tools to analyze your energy usage. Select the CUSUM tab in the Targeting view. The CUSUM chart displays the CUmulative SUm of the deviation between actual and target dependent variable in successive intervals. The CUSUM chart has a number of properties that provide tools in analyzing your energy usage.
CHAPTER 9 ReportsPlus ReportsPlus provides you a package of enhanced reports in addition to the standard reports included in Manager. ReportsPlus reports are set up and viewed in the same way as standard Manager reports and can be configured to automatically run on a schedule and optionally send the report output to one or more email addresses. Custom reports can be created using Excel template in FactoryTalk EnergyMetrix software version 2.10.00 with ReportsPlus option.
FactoryTalk EnergyMetrix Software Rate Schedule Setup Before you set up an efficiency report, set up a Rate schedule that defines the efficiency calculation. Enter the efficiency calculation in Line Item 1 in the rate schedule. Set up the line item script to perform the efficiency calculation and set the Quantity variable to the result. A sample line item script for calculating boiler efficiency (in British units) is provided below: Dim avg_gas, avg_steam avg_steam=Average(ValueType.
9 • ReportsPlus Report Run-time Options Make the following selections from the Report Parameters list at report run time and click View to generate and view the report. Time Zone Select the time zone in which you wish the report to run. Start Date and End Date and Times Select a predefined or custom report period. If fiscal calendar functionality is enabled, predefined fiscal periods will appear in the list. Use the Pick links to graphically select the dates.
FactoryTalk EnergyMetrix Software Report File Use the default file ElectricalSummary.rpx. Report Parent Group Leave None selected for a Global report or select a parent group from the pull-down menu. Meter Selections Select Meters or Groups from the tree in the Add a Report screen. Click the Select by link to toggle between by Meters and by Groups selection criteria.
9 • ReportsPlus Report Parent Group Leave None selected for a Global report or select a parent group from the pull-down menu. Meter Selections Select Meters or Groups from the tree in the Add a Report screen. Click the Select by link to toggle between by Meters and by Groups selection criteria. Report Run-time Options Make the following selections from the Report Parameters list at report run time and click the View button to generate and view the report.
FactoryTalk EnergyMetrix Software Power Factor Report The Power Factor report lists real energy net, reactive energy net, and power factor (which is calculated from the real energy and reactive energy values) for selected meters for a selected date range divided into specified calculation intervals (hours, days, or months). Report output is tabular with a chart of power factor on the first page.
9 • ReportsPlus Report Period Select a predefined or custom report period. If fiscal calendar functionality is enabled, predefined fiscal periods will appear in the list. Use the Pick links to graphically select the dates. Calculation Interval Select Hours, Days (default) or Months from the pull-down menu. To limit the size of reports, FactoryTalk EnergyMetrix limits the Date range based on your selection of Calculation interval according to the following table.
FactoryTalk EnergyMetrix Software Multi-purpose Reports The Multi-purpose Report (MPR) is a free-form report driven by script code stored in a Multi-Purpose Report Script. The MPR is part of the ReportsPlus option. Multi-purpose Report Script A MPR Script defines what a MPR contains and what it looks like. A MPR script is conceptually similar to a rate schedule. Like a rate schedule, a MPR script is combined with selected meters or groups to form a specific report instance.
9 • ReportsPlus Rich Text Box The Rich Text Box provides a way to place text on a MPR. The MPR script contains code that creates the Rich Text Box and controls its location, size, content, and formatting. Page Header and Footer The page header contains identifying elements such as the report title, the report headings from the Group setup, the report time range and time zone, and a user-selectable graphic element. The page footer contains the report page number and the date and time the report was printed.
FactoryTalk EnergyMetrix Software 4. Check Use Intervals to allow the report user to select the report interval from among Days, Weeks, and Months at report run-time. 5. Enter any comments or notes in the Notes field. 6. Select the Script tab and enter the MPR script in the Script field. 7. To check the validity of the script, click Validate. Any errors are displayed in the Validation results field at the bottom of the screen. 214 The Objects link opens the MPR object help topic.
9 • ReportsPlus The editing window does not display line numbers. To help determine the line number of an error, temporarily add a line before the error line with an obvious syntax error, such as a number. Click the validate button and the new line will be displayed with its line number. If no error is found, a message appears under the Validate button. Save your script frequently. When you save a script, a validation is performed and if errors exist the script will not be saved.
FactoryTalk EnergyMetrix Software All other MPR objects must be declared as the applicable Object type. Variables and constants should be declared as the appropriate data type. The first character of any script element name must be an alphabetic character, a digit, or an underscore.
9 • ReportsPlus Functions The MPR script can also contain user-defined functions: Sub Main() [declarations] [main routine script] For Each item In collection variable = Function1(arg1, arg2, ...) Next item End Sub Function Function1(arg1 As Type, arg2 As Type, ...) [declarations] [function script] End Function Create an MPR Object The MPR lets you select from a number of report elements including a Grid, a Trend Chart, a Pie Chart, and a Rich Text Box. Each report object may differ in some details.
FactoryTalk EnergyMetrix Software Create an MPR Excel Report Please contact Rockwell Automation technical support or visit the Rockwell Automation Knowledgebase for information on using the Excel template in MPR reports. Configure an MPR Object The properties and methods of MPR objects permit a great deal of customizing and formatting. Each object has a unique set of configurable properties. Refer to the MPR object model for details of each.
9 • ReportsPlus .SeriesLegendBox = True End With ... 'as each data series is created, the following configures the data series legend: chart1.SeriesLegend = Configuring a PieChart Object A PieChart object has only a few configurable properties. The following example creates a pie chart object and configures its properties. dim chart2 As PieChart() ... chart2 = New PieChart() With chart2 .Title.Text = "Energy Dollars (thousands)" .Chart3D = False .
FactoryTalk EnergyMetrix Software Grid Example This example populates a Grid object that lists real energy consumption and cost per meter. The Grid object is configured with four columns, headed ‘Meter’, ‘Actual Consumption’, units, and ‘Actual Cost’. Sub Main() 'declarations omitted ... 'object creation and configuration omitted ... For Each meter In Report.Meters actualConsumption = meter.Total(ValueType.RealEnergyNet) actualCost = meter.
9 • ReportsPlus Configure the Report Object The Report object includes among its members several properties and methods that control the overall appearance of a Multi-Purpose Report (MPR). ShowLogo Property This controls whether the logo graphic is displayed in the report header. The default is True, and the default logo is the FactoryTalk EnergyMetrix logo: Report.
FactoryTalk EnergyMetrix Software Add a Report Object to the MPR Adding the MPR object is the last step in placing a report element into a MPR. Use the Add Method of the Report object to add a MPR object to a Report. Before the MPR script adds a MPR object to the report, the object must be created, configured and populated with data. Once an object is added to the report, it can no longer be accessed by the MPR script. The following examples demonstrate the use of the Add method.
9 • ReportsPlus 223
FactoryTalk EnergyMetrix Software Page Layout Variables The MPR provides several scripting elements used to locate MPR objects on the page and determine their size and shape: [Functions].CursorPos is a global read/write variable that corresponds to the vertical distance from the top of the working report area. [Functions].MoveCursorPos(Inches) is a global function that moves the cursor vertically on the page by the specified amount (downward for positive Inches), from the previous CursorPos.
9 • ReportsPlus 4. Enter a Report Name. 5. Select Multi-Purpose Report from the Report Template pull-down menu. 6. Select a Report Parent Group if different than the group selected. 7. Select a MPR script from the pull-down menu. 8. Select the Meters and/or Groups for the report from the selection tree. Setting up MPR Run-time Parameters and Running the Report 1. Select the Multi-purpose report from the Navigation tree. MPR Excel reports export to a Microsoft Excel .xlsx file.
FactoryTalk EnergyMetrix Software Selecting Groups and Meters in the MPR It is important to understand the relationship between the Group and Meter selections made when setting up a Multi-purpose Report and the methods for accessing the selected Groups and Meters in the MPR script. The members of the Groups, Meters, and Nested Groups collections are selected in the Reports Plus setup screen selection tree. The organization and membership of the collections depend upon the Select By mode chosen.
9 • ReportsPlus The illustration provides an example of how the Report.Groups and Report.NestedGroups collections are populated. In the example, Sub group 3a may be addressed Report.Group(4) or Report.NestedGroup(2).Group(0). Select By: Groups and Meters Select By: Groups and Meters populates the Report.Groups and Report.NestedGroups collections (and child groups) in exactly the same way as Select By: Groups. However, only the selected meters in each selected group are included in that groups group.
FactoryTalk EnergyMetrix Software Use the MPR for Cost Allocation True ‘cost allocation’ across groups and meters can be performed by using MPR scripts by calling the CostAllocate method of the Group or Meter objects. The two most common types of cost allocation include: Calculating an overall energy rate for a site and applying it to groups or meters within the site. Finding site peak demand and allocating cost to groups or meters based on their contribution to that peak demand.
9 • ReportsPlus Billing Report Requirements A cost allocation rate schedule must be assigned to a group such that when the CostAllocate method of a Group or Meter object is called then the billing report and rate schedule can be located by searching up the tree from the group or meter. If either the billing report or the cost allocation rate schedule cannot be found then the CostAllocate method will return a value of zero.
FactoryTalk EnergyMetrix Software 3. Add Line Item 1 which calculates the charge for real energy net. 4. Add Line Item 2 which calculates a prorated fixed monthly charge. 5. Add Line Item 3 which calculates the cost allocation rate. 6. Save the Billing Report rate schedule. 7. Create a Billing Report based on the Billing Report rate schedule. 8. Create a new Cost Allocation rate schedule with a run-time parameter named the same as the run-time parameter in the billing rate schedule.
9 • ReportsPlus This will normally be quite a simple rate schedule as it is just taking the rate passed from the billing report and applying it to the consumption. 9. Create a line item to apply the cost allocation rate to each meter's consumption. 10. Create the MPR script code to call the CostAllocate method of a Group or Meter object. Dim charge As Double Charge = Group.
FactoryTalk EnergyMetrix Software The MPR Object Model Legend: Object Collection Information 232
9 • ReportsPlus Axis Object The Axis object is used to modify axis properties on a trend or bar chart. Instancing The Axis object is not a creatable object.
FactoryTalk EnergyMetrix Software BarChart Object The BarChart object is used to display a bar chart on the report. The bar charts can display one or more data series in a side-by-side or stacked format. Side-by-side and stacked can be combined in the same chart. Instancing The BarChart object is a creatable object. Accessing MPR script code can create BarChart objects as needed by using the New operator.
9 • ReportsPlus Methods Method Description BarChart() As BarChart Create a BarChart object AddData(Data As Double) Add a data point to the bar chart AddData(Timestamp As DateTime, Data As Double) Add a time series data point to the bar chart NextSeries() Close the current data series and create a new one. This is used when the bar chart will contain multiple data series.
FactoryTalk EnergyMetrix Software Instancing The Col object is a creatable object Accessing MPR script code can create Col objects by using one of the AddCol methods of a Grid object Properties Property R/W Description Alignment As TextAlignment R/W Controls the alignment of text within the column HeaderText As String R/W The text that will appear in the column header.
9 • ReportsPlus Properties Property R/W Description Day(index) As Day R Collection of Day objects that represent the report date range in periods of days Methods Method Description Days(StartDate As DateTime, EndDate As DateTime) Create a Days object containing Day objects representing the days between StartDate and EndDate, inclusive Day Object The Day object presents a time period of one day. Instancing The Day object is a creatable object.
FactoryTalk EnergyMetrix Software Properties Property R/W Description FiscalYearNumber As Integer R The fiscal year number (2009) FiscalMonthNumber As Integer R The fiscal month number (1…12) StartDate As DateTime R The starting date of the fiscal month (9/28/2009 00:00:00) EndDate As DateTime R The ending date of the fiscal month (10/4/2010 00:00:00) Methods Method Description AddFiscalMonths(int Gets the fiscal month object for the fiscal month specified as an offset numFiscalMonths) As
9 • ReportsPlus Fiscal Quarter Object The FiscalQuarter object represents one fiscal quarter. Instancing The FiscalQuarter object is not a creatable object Accessing Each FiscalQuarter object is accessed via the FiscalQuarters collection Properties Property R/W Description FiscalYearNumber As Integer R The fiscal year number (2009). FiscalQuarterNumber As Integer R The fiscal quarter number (1…4).
FactoryTalk EnergyMetrix Software Properties Property R/W FiscalQuarters(index) As R FiscalQuarter Description Collection of FiscalYear objects that represent the report date range in periods of fiscal years Fiscal Week Object The FiscalWeek object represents one fiscal week.
9 • ReportsPlus Properties Property R/W Description FiscalWeeks(index) As FiscalWeek R Collection of FiscalYear objects that represent the report date range in periods of fiscal years Fiscal Year Object The FiscalYear object represents one fiscal year.
FactoryTalk EnergyMetrix Software Properties Property R/W Description FiscalYears(index) As R FiscalYear Collection of FiscalYear objects that represent the report date range in periods of fiscal years Font Object The Font object permits changing the fonts used in Multi-Purpose Report chart objects from the default font (Arial, 8 pt.). Applies to The Font object allow changing the font through scripting for the following chart objects: [ChartObject].XAxis [ChartObject].YAxis [ChartObject].
9 • ReportsPlus More Information Consult the Microsoft .NET Framework documentation for more information on the System.Drawing.Font class including various ways to construct new Font objects Global Functions and Variables MPR script may use these functions and variables to format the report output. Variables Variable R/W Description [Functions].CursorPos As Double R/W The current position of the cursor on the report. The cursor represents the current vertical position on a report.
FactoryTalk EnergyMetrix Software Properties Property R/W Description Cols As ArrayList R The collection of Col objects contained in the grid FontSize As Integer R/W The font size (in points) for grid text. Default is 10 HeaderHeight As Float R/W The height of the column headers (in inches). Default is .125 Rows As ArrayList R The collection of Row objects contained in the grid ShowHorizontalLines As Boolean R/W Controls the display of horizontal grid lines.
9 • ReportsPlus Properties Property R/W Description Group(index) As Group R Collection of Group objects that represent the groups that are selected in the report's groups/meters tree Group Object The Group object represents one group that is selected on the report groups/meters tree. See Selecting Groups and Meters in the MPR on page 226 for more information. Instancing The Group object is a creatable object.
FactoryTalk EnergyMetrix Software Methods Value type or tag related methods (for example, Average, and Peak) of the Group object return aggregated results based on all meters included in the selected Group(index).Meters collection. For more information on usage of the methods, refer to the applicable rate schedule functions. Method Description AddMeter(fullyQualifiedPathName As String | MeterID As Integer) Adds an existing Meter to a Group object.
9 • ReportsPlus Method Description NLowestTimestamps(ValueType.enumV Returns a DateTime array of N elements containing the UTC time stamps of alue, int N[, DateTime startDate, the N smallest instances of the selected ValueType over the report date/time DateTime endDate]) range (or the specified date/time range if optional startDate and endDate arguments are present) NPeaks(ValueType.
FactoryTalk EnergyMetrix Software Method Description TargetTotal(ValueType.enumValue[, Calculates the target value of the specified value type for the group for the DateTime startDate, DateTime report date/time range (or the specified date/time range if the optional endDate]) startDate and endDate arguments are present). This method works with targets saved for the group in ChartsPlus X-Y trend charts.
9 • ReportsPlus Properties Property R/W Interval(index) As Interval R Description Collection of Interval objects that represent the report date range in intervals Methods Method Description Intervals(IntervalType intervalType, DateTime startDate, DateTime endDate) Create an Intervals object containing Interval objects representing the intervals between StartDate and EndDate, inclusive Enums Enum Description IntervalType.Day IntervalType.Month IntervalType.Week The types of intervals available.
FactoryTalk EnergyMetrix Software Properties Property R/W Description StartDate As DateTime R The starting date of the Interval object (1/1/2003 00:00:00) EndDate As DateTime R The ending date of the Interval object (1/2/2003 00:00:00) Methods Method Description Interval (startDate As Create an Interval object representing a time period DateTime, endDate As DateTime) Meters Collection The Meters object is a collection of Meter objects.
9 • ReportsPlus Properties Property R/W Description GroupId As Int R/W The database id that identifies the group containing the meter MeterId As Int R/W The database id that identifies the meter MeterType As Int R/W The type of the meter Name As String R/W The name of the meter Methods Value type or tag related methods (for example, Average and Peak) of the Meter object return results based on the selected meter.
FactoryTalk EnergyMetrix Software Method Description NLowest(ValueType.enumValue, int N[, DateTime startDate, DateTime endDate]) Returns a Double array of N elements containing the N smallest instances of the selected ValueType over the report date/time range (or the specified date/time range if optional startDate and endDate arguments are present) NLowestTimestamps(ValueType.
9 • ReportsPlus Method Description TargetTotal(ValueType.enumValu Calculates the target value of the specified value type for the meter for the e[, DateTime startDate, report date/time range (or the specified date/time range if the optional DateTime endDate]) startDate and endDate arguments are present). This method works with targets saved for the meter in ChartsPlus X-Y trend charts.
FactoryTalk EnergyMetrix Software Properties Property R/W Description Month(index) As Month R Collection of Month objects that represent the report date range in periods of months Methods Method Description Months(StartDate As Create a Months object containing Month objects representing the DateTime, EndDate months between StartDate and EndDate, inclusive. As DateTime) Month Object The Month object presents a time period of one month.
9 • ReportsPlus NestedGroups Collection The NestedGroups object is similar to the Report.Groups object in that it contains a collection of Group objects. However, Report.Groups is a flat array of Groups, while Report.NestedGroups is a hierarchical collection of Group objects that mimics the tree structure of the report selection tree. The members of the collection are selected in the MPR setup. See Selecting Groups and Meters in the MPR on page 226 for more information.
FactoryTalk EnergyMetrix Software row(0) = tabSpace + group.Name BuildNestedGroupsGrid(group, " Next group End Sub " + tabSpace) PieChart Object The PieChart object is used to create a pie chart on the report. Instancing The PieChart object is a creatable object. Accessing MPR script code can create PieChart objects as needed by using the New operator.
9 • ReportsPlus Properties Property R/W Description Days As Days R Collection of Day objects that represent the report date range in periods of day length EndDateTime As DateTime R/W The ending date/time of the report date range Groups As Groups R Collection of Group objects that represent the groups that are selected on the report's group tree IntervalTypeString As String R The interval type selected by the user when the report is run (Day, Week, Month) Meters As Meters R Collection of Me
FactoryTalk EnergyMetrix Software Property R/W Description ShowPageHeader As Boolean R/W Controls the visibility of the standard page header. Default value is true ShowPageFooter As Boolean R/W Controls the visibility of the standard page footer.
9 • ReportsPlus Method Description AddLogo(Left As Double, Top As Double, Add a picture to the report page header with the specified coordinates Width As Double, Height As Double, and size. If the original picture is not the same size as the specified File As String) size then the picture will be re-scaled to fit and the aspect ratio of the picture will not be maintained if the specified size is different from the original size. The File parameter can be either an absolute file path (C:\Logos\OurLogo.
FactoryTalk EnergyMetrix Software Method Description NLowestTimestamps(ValueType.enumValue Returns a DateTime array of N elements containing the UTC time , int N[, DateTime startDate, DateTime stamps of the N smallest instances of the selected ValueType over the endDate]) report date/time range (or the specified date/time range if optional startDate and endDate arguments are present) NPeaks(ValueType.
9 • ReportsPlus Enums Constant Description PageOrientation.Portrait PageOrientation.Landscape Specifies the page orientation PaperKind.A2 PaperKind.A3 PaperKind.A4 PaperKind.B4 PaperKind.B5 PaperKind.B6 PaperKind.Custom PaperKind.Executive PaperKind.Legal PaperKind.Letter PaperKind.Tabloid Specifies the paper size ReportPeriod.None ReportPeriod.Yesterday ReportPeriod.Today ReportPeriod.LastWeek ReportPeriod.PreviousWeek ReportPeriod.MonthToDate ReportPeriod.PreviousYear ReportPeriod.
FactoryTalk EnergyMetrix Software All codes must be followed by a space character. As an example, ‘\fs24 My Text \b Is Bold \b0’ will work while ‘\fs24 My Text \b Is Bold \b0’ will cause a run-time error because there is no space character after the \b0 code. Instancing The RichTextBox object is a creatable object. Accessing RichTextBox objects are created by using the New operator.
9 • ReportsPlus Properties Property R/W Description Row(Index As Integer) R/W The data at column Index. The first column is Index value zero. Selecting Groups and Meters in the MPR It is important to understand the relationship between the Group and Meter selections made when setting up a Multi-purpose Report and the methods for accessing the selected Groups and Meters in the MPR script.
FactoryTalk EnergyMetrix Software The illustration provides an example of how the Report.Groups and Report.NestedGroups collections are populated. In the example, Sub group 3a can be addressed Report.Group(4) or Report.NestedGroup(2).Group(0). Select By: Groups and Meters Select By: Groups and Meters populates the Report.Groups and Report.NestedGroups collections (and child groups) in exactly the same way as Select By: Groups.
9 • ReportsPlus TrendChart Object The TrendChart object is used to create a trend chart on the report. Instancing The TrendChart object is a creatable object. Accessing MPR script code can create TrendChart objects as needed by using the New operator.
FactoryTalk EnergyMetrix Software Properties Property R/W Description Border As Boolean R/W Controls the visibility of a border around the entire pie chart area, including title and legend areas Title.Text As String R/W The title that will appear above the trend chart XAxis As Axis R Axis properties for the X axis of the trend chart YAxis As Axis R Axis properties for the Y axis of the trend chart MarkerSize As Short W Controls size of data markers on trend line. Default is 3.
9 • ReportsPlus Example This example Multi-Purpose Report script creates a trend chart with three data series. The first data series will be displayed as a bar chart and the second and third data series will be displayed as trend lines. Dim trendChart As New TrendChart() trendChart.SeriesType = SeriesType.Bar trendChart.AddData("Jan", 100) trendChart.AddData("Feb", 200) trendChart.AddData("Mar", 300) trendChart.NextSeries trendChart.SeriesStacked = true trendChart.AddData("Jan", 5420) trendChart.
FactoryTalk EnergyMetrix Software Properties Property R/W Description Week(index) As Week R Collection of Week objects that represent the report date range in periods of weeks Methods Method Description Weeks(StartDate As DateTime, EndDate As DateTime) Create a Weeks object containing Week objects representing the weeks between StartDate and EndDate, inclusive Week Object The Week object presents a time period of one week.
9 • ReportsPlus Excel Object The Excel object provides the capability to create Excel reports via the MPR scripting capability. This functionality is based on utilizing an existing Excel spreadsheet with formatting, trends and charts already defined, and then using the script to populate the spreadsheet with data from FactoryTalk EnergyMetrix. Instancing The Excel object is not a creatable object. Accessing The Excel object is accessible from a MPR script via the Report global variable.
FactoryTalk EnergyMetrix Software Accessing MPR Excel script code accesses the workbook that is automatically opened with the script runs. Properties Property R/W Description Properties As DocProperties R/W Document properties collection that can be used to set specific properties for any Office XML document, such as: Author, Title, Subject, Category, Comments, Keywords, Status, LastModifiedBy, Company, Manager, etc.
9 • ReportsPlus Accessing MPR Excel script code accesses the workbook that is automatically opened when the script runs. Properties Property R/W Description Properties As R/W DocProperties Document properties collection that can be used to set specific properties for any Office XML document, such as: Author, Title, Subject, Category, Comments, Keywords, Status, LastModifiedBy, Company, Manager etc.
FactoryTalk EnergyMetrix Software Methods Method Description Add(WorksheetName As Create a Worksheet within the workbook and returns a String) worksheet object Delete(WorksheetName Delete a Worksheet within the workbook As String) Worksheet Object The Worksheet object presents a worksheet within the workbook that the MPR Excel script is working with. Instancing The Worksheet object is a creatable object.
9 • ReportsPlus Range Object The Range object presents a range within a worksheet of the workbook that the MPR Excel script is working with. Instancing The Interval object is not a creatable object. Accessing The Workbook object automatically creates Range objects for each worksheet in the workbook (accessible using the Excel.Workbook.Worksheets.Ranges property) and MPR Excel script code can access any range in a worksheet using the Range objects.
FactoryTalk EnergyMetrix Software Methods Method Description FirstCell() as Cell Returns part of Range to identify the ranges cells, columns and rows etc. FirstCellUsed()as Cell Returns part of Range to identify the ranges cells, columns and rows etc. FirstColumn() as Column Returns part of Range to identify the ranges cells, columns and rows etc. FirstColumnUsed() as Column Returns part of Range to identify the ranges cells, columns and rows etc.
9 • ReportsPlus Enums Constant Description XLShiftDeletedCells.ShiftCellsLeft XLShiftDeletedCells.ShiftCellsUp Specifies how cells are shifted when a specified range is deleted. Cell Object The Cell object presents a cell within a worksheet of the workbook that the MPR Excel script is working with. Instancing The Cell object is not a creatable object. Accessing The Workbook object automatically creates Cell objects for each worksheet in the workbook (accessible using the Excel.Workbook.Worksheets.
FactoryTalk EnergyMetrix Software Row Object The Row object presents a row within a worksheet of the workbook that the MPR Excel script is working with. Instancing The Row object is not a creatable object. Accessing The Workbook object automatically creates Row objects for each worksheet in the workbook (accessible using the Excel.Workbook.Worksheets.Rows property) and MPR Excel script code can access any row in a worksheet using the Row objects.
9 • ReportsPlus Column Object The Column object presents a column within a worksheet of the workbook that the MPR Excel script is working with. Instancing The Column object is not a creatable object. Accessing The Workbook object automatically creates Column objects for each worksheet in the workbook (accessible using the Excel.Workbook.Worksheets.Columns property) and MPR Excel script code can access any column in a worksheet using the Column objects.
FactoryTalk EnergyMetrix Software Excel spreadsheet sample This sample MPR Excel Report script populates an existing Excel spreadsheet with document properties, basic cell values as well as populate the sheet with meter data, that could be used for trend charts, bar charts etc. in excel. It uses the Excel.SetCell function that simplifies the process of populating Excel cells with various content. In this script, the worksheet name is included in the Excel.
9 • ReportsPlus Excel.Workbook.Properties.Status = "Status goes here" Excel.Workbook.Properties.LastModifiedBy = "Last modified by" Excel.Workbook.Properties.Company = "Company Name" Excel.Workbook.Properties.Manager = "Manager Name" ' Create and set some custom properties of the Excel workbook. Excel.Workbook.CustomProperties.Add ("ACustomStringProperty", "String property") Excel.Workbook.CustomProperties.Add ("ACustomDateProperty", DateTime.Now) Excel.Workbook.CustomProperties.
FactoryTalk EnergyMetrix Software Sample MPR Scripts The following sections describe sample MPR scripts. Consumption and Cost Per Meter Grid The report generated by this sample MPR script uses a Grid object to list real energy consumption and cost by meter. Each meter shows up on the report as a row of data within the grid. Meters must be selected ‘By Meter’ in the report setup selection tree. The grid will be sorted by cost, descending.
9 • ReportsPlus The script uses the Groups and Intervals collections and the Group, Report, Interval and TrendChart objects. To use this script, check the Use Intervals checkbox on the MPR script setup page. Select By Groups to run this report. Sub Main() Dim objGroup As Group Dim intInterval As Interval Dim consumption As Double Dim trendChart As New TrendChart() With trendChart .XAxis.Title = Report.IntervalTypeString & " Ending Date" .YAxis.Title = "Consumption (kWh)" '.XAxis.Step = 7 .XAxis.
FactoryTalk EnergyMetrix Software Cost by Group Pie Chart This sample MPR script generates a report with a pie chart showing cost by group. Each group consists of multiple utilities and each utility has its own rate schedule. The utility costs for each group are prorated based on the monthly site rate schedule for the utility. Rate schedules must be set up to support cost allocation. See Use the MPR for Cost Allocation on page 228.
9 • ReportsPlus End With objCol = objGrid.AddCol("Ending Date") With objCol .Width = 1.2 End With objFM = Report.FiscalMonths(Report.FiscalMonths.Count 1) 'selects most recent fiscal month in report period Do While Not objFM Is Nothing objRow = objGrid.AddRow() objRow(0) = objFM.FiscalYearNumber objRow(1) = Format(objFM.StartDate.AddDays(14),"MMMM") objRow(2) = objFM.EndDate.Subtract(objFM.StartDate).Days / 7 objRow(3) = Format(objFM.EndDate, "d") objFM = objFM.AddFiscalMonths(-1) Loop Report.
FactoryTalk EnergyMetrix Software 'populate utility name and total accruals lines With objRtb1 .Text = "\fs20\caps\b " & strUtility & "\caps0\par " .Text &= "Total Accrual: " & Format(dblTotalAccrual, "c") & "\b0\par " End With 'populate horiz bar charts and legend 'uses RTF color table and font table, don't change With objRtb2 .Text = "{\colortbl;\red0\green0\blue0;\red0\green0\blue255;\red0\green2 55\blue255;" .Text &= "\red0\green255\blue0;\red255\green0\blue255;\red255\green0\blue 0;" .
APPENDIX How to Administer FactoryTalk EnergyMetrix Software These sections provide information for working with FactoryTalk EnergyMetrix software. Changing Your Password Follow these steps to change your password. 1. Select the System folder in the navigation tree and then My User Settings. 2. Click Change Password. 3. Enter your new password in both fields and click Save to change your password or Cancel to leave it unchanged.
FactoryTalk EnergyMetrix Software Many FactoryTalk EnergyMetrix software users maintain established backup and archiving procedures for business databases. FactoryTalk EnergyMetrix software does not require any unusual or extraordinary handling of its data, so established IT database procedures should meet the backup needs. Rockwell Automation recommends a daily scheduled backup and shrink of the EMMA database.
Appendix • During an upgrade, FactoryTalk EnergyMetrix software reads configuration parameters from the existing web.config file and stores them in the database. FactoryTalk EnergyMetrix is one software package with multiple options that are enabled by installing activations. The Manager software available on the software updates download page also includes the options such as RT, ChartsPlus, ReportsPlus, and FTEMOPC. Installing these options does not require reinstalling the software.
FactoryTalk EnergyMetrix Software 6. From the installation screen, select Install FactoryTalk EnergyMetrix. 7. On the dialog box that appears, select Remove all installed components. If an error message appears related to the installation script version, exit the installation program. Use the Windows Control Panel Add/Remove Programs application to remove FactoryTalk EnergyMetrix. Then re-start the FactoryTalk EnergyMetrix installer and install the new version. 8.
Appendix • You will see a message that the existing FactoryTalk EnergyMetrix database has been found and updated if needed. The installer will copy program options from the previous web.config file into the database (new in version 1.5) 9.
FactoryTalk EnergyMetrix Software System Configuration Report The system configuration report can be found on the System tab. This report can be configured to document the configuration of any or all of the objects listed in the report setup page. In addition, you can select all groups or an individual group / domain and its subgroups. Groups are limited to those accessible to your login role.
Appendix • System Configuration To access the Configuration page, click the System tab and then choose the Configuration item in the navigation tree. Click Edit to change settings. You must have Edit System Configurations privileges to make changes. Program Options Logger Telnet Debugging Telnet debugger, enabled or disabled (default) Remote debug port, any unused port ID, default 23 Remote debug password, default "".
FactoryTalk EnergyMetrix Software Email SMTP Server Configuration FactoryTalk EnergyMetrix sends email alarms and reports via a SMTP server configured by using this page.
Appendix • Release Notes The following sections include the release notes for FactoryTalk EnergyMetrix software versions 2.1 and 2.0. New features and enhancements in FactoryTalk EnergyMetrix 2.10.00 FactoryTalk EnergyMetrix software supports the Allen-Bradley PowerMonitor 5000 M6 unit. FactoryTalk EnergyMetrix software supports ControlNet for connecting to PowerMonitor 5000. SEMI F47-0706 (2006) standard added to the PowerMonitor 5000 and PowerMonitor 3000 Sag/Swell graph/chart.
FactoryTalk EnergyMetrix Software Updated FactoryTalk activation manager to version 3.40 (CPR 9 SR 4). Internet Explorer WebControls are no longer used. Pareto Chart added to standard reports. Issues Resolved in Version 1.9 ADR wizard for ControlLogix hard-coded the COP instruction for 10 tags. PQ Event logging would relog last event after logger restart. Demand Analysis report showed 0% for percent contribution. MicroLogix device type was missing its icon.
Appendix • 1. Open the Windows Services control panel. 2. Shut down the FactoryTalk EnergyMetrix logger service. 3. Open the RSLinx Classic Launch Control Panel. 4. Stop the RSLinx Classic software service. 5. Uncheck Always Run As Service. 6. Start RSLinx Classic software as an application. 7. Click the RSLinx Classic icon in the systray to open the user interface. 8. Make the changes that require use of the RSLinx Classic user interface. 9.
FactoryTalk EnergyMetrix Software 5. Click Finish. RT and ChartsPlus Security RT and ChartsPlus options run as ClickOnce applications by default. They can also be run as Rich Client application. ClickOnce Operation of RT and ChartsPlus The first time these applications run on a client, the user is prompted with a security message. Click Run to enable ChartsPlus to run. After the first time, this warning no longer appears. ClickOnce applications run on Windows 32- and 64-bit operating systems with .
Appendix • IEExec Operation of RT and ChartsPlus You can optionally disable ClickOnce operation of these options and run them as Rich Client applications in the IEExex.exe shell on your 32-bit Windows client computer. If you operate these options in this way, make the following security settings on each client computer: 1. Add the FactoryTalk EnergyMetrix server to the list of Trusted Sites. To do this, follow these steps: a.
FactoryTalk EnergyMetrix Software Integrated Architecture Energy Management Accelerator Toolkit This toolkit provides easy to use system design, programming, and analysis tools to assist you in the rapid development and deployment of an energy monitoring and analysis system using Rockwell Automation's PowerMonitor and CompactLogix energy collection devices and FactoryTalk EnergyMetrix energy management software.
Appendix • 7. The RT (Real Time) and ChartsPlus options will only run as ClickOnce applications on a 64-bit operating system. 8. The .NET Framework must be installed after IIS is installed and running. If IIS is installed after these components then you must reinstall those components. 9. If a Powermonitor on Remote I/O Device is created with a rack/group address that does not exist, the RT device viewer may display bogus data. 10.
FactoryTalk EnergyMetrix Software Fiscal Calendars Fiscal calendars allow users to configure and utilize custom reporting periods based on a fiscal calendar rather than a natural calendar. A fiscal year is defined by specifying the start month, day, and the type of calendar. Fiscal calendars include a Natural type, which uses the same months as a natural calendar but a different start month, and three types based on repeating patterns of weeks within fiscal quarters.
Appendix • Second Previous Fiscal Year (FY2007) Multi-purpose Report Object Model Several objects and collections have been added to the MPR object model to support fiscal period reporting in custom reports. Fiscal calendar functionality are enabled and disabled from the System Configuration page via radio buttons. Fiscal Calendar functionality will be disabled by default. Fiscal calendar related objects become visible in the web interface the next time a user logs in.
FactoryTalk EnergyMetrix Software Start year, Month, and Day The date the fiscal year begins. Leap Months A particular month may be added to a selected fiscal year to align the fiscal calendar with the natural calendar. This may be the same or a different month each time it occurs. Clicking one of the View monthly calendars links will display a 12-month fiscal calendar for the selected fiscal year.
Appendix • Troubleshooting The questions and answers listed below should help you resolve most issues you encounter with installation and operation. Additional assistance can be found on the Rockwell Automation knowledgebase. Q: I receive a Server Error the first time I log in to an installation of version 1.8 and later. A: Version 1.8 and later requires Microsoft .NET Framework version 3.5 SP1, which uses ASPNET version 2.0. It is likely that the web page is configured to use ASPNET 1.1.
FactoryTalk EnergyMetrix Software 9. Click OK. If IIS 6.0 is configured to use ‘IIS 5.0 isolation mode’ then select the user named ASPNET instead of IUSR_machinename. If the steps above do not resolve the issue, also check that user Network Services has read/write access to the directory. Q: I just upgraded my installation with a core file set downloaded from the web. I ran setup.exe and now the program no longer works. A: Running setup.exe the first time uninstalls the software.
Appendix • Q: Reports do not run. I click the View button but nothing happens. A: It is likely that Internet Explorer or a helper application (such as Google toolbar) is configured to block popups. Turn off the popup blocker for the FactoryTalk EnergyMetrix website. Q: Reports do not run. The report builder screen just runs forever. What should I check? A: The ReportsOutput folder under the program folder needs the same users assigned with read/write access as in the ‘Access to the path’ FAQ above.
FactoryTalk EnergyMetrix Software For EtherNet/IP devices such as ControlLogix, CompactLogix, PowerMonitor 1000 and 3000 devices, open RSWho on the server computer, drill down to and select the power monitor or Logix processor module. Then try Test Connection again. Access the server computer and Ping the devices from a command window. If the Ping fails, correct the networking problem and try again. Q: When I click the Devices folder in the System tab, the device status page does not display.
Appendix • For pass-thru devices such as Remote I/O power monitors, other applications may be reading data from the parent device. It may be necessary adjust the update rates of the competing applications so that the device may respond adequately to all of them. For systems with many devices, meters and/or tags, meter tag logging rates may be set too low to complete the logging task in the time allotted.
FactoryTalk EnergyMetrix Software Click any device link to open a new browser window with detailed information on the device and its associated meters and meter tags. Telnet You can connect to the FactoryTalk EnergyMetrix server by using Telnet to perform a number of diagnostic tasks. Telnet is enabled or disabled (default) by using the Configuration page. You can also select a remote debug port (default 23) and a password (default ""). See System Configuration on page 23 for more information.
Appendix • 3. Enter a question mark then press to list the available commands. In addition to processing the commands you enter, the console will display a running record of logging activity. 4. To exit the Telnet session, press ] and then type quit to close the window. Time Zone Issues Time zones are independently set for meters, devices, rate schedules, reports, and the server. All data is stored in the database with a UTC time stamp.
FactoryTalk EnergyMetrix Software Error Codes Error codes listed in the System Status or Device Status detail screens are passed through from RSLinx Classic. The most common error codes are listed here. Error Code: 1 Error Description: Driver name is invalid Detailed Description: This error can usually be corrected simply by opening RSWho in RSLinx and verifying the device is communicating (that is, there is no red X through the device).
Appendix • End-User License Agreement END-USER LICENSE AGREEMENT (Rev Jan/2012) IMPORTANT—READ THIS AGREEMENT CAREFULLY: This End-User License Agreement (“EULA”) is a legal contract between you (either an individual or a single entity) (“You or Licensee”) and Rockwell Automation, Inc. (‘Rockwell Automation’) for the software product or products that Rockwell Automation licenses to You, which includes computer software, technology and may include associated media (“Software”).
FactoryTalk EnergyMetrix Software You desire additional capacity for your Software, You agree to purchase such additional capacity only from Rockwell Automation or its authorized distributors and resellers. If the Software You have acquired is used in a virtualized environment, whether in a client or server application, the number of concurrently used virtual environments or instances may not exceed the number of valid software activations You purchased.
Appendix • MERCHANTABILITY OR FITNESS FOR A PARTICULAR PURPOSE OR ANY WARRANTY UNDER UCITA. SOME JURISDICTIONS DO NOT ALLOW THE EXCLUSION OF IMPLIED WARRANTIES, SO THE ABOVE EXCLUSION MAY NOT APPLY TO YOU. THIS WARRANTY GIVES YOU SPECIFIC LEGAL RIGHTS, AND YOU MAY ALSO HAVE OTHER RIGHTS WHICH VARY FROM JURISDICTION TO JURISDICTION. LIMITATION OF REMEDIES Rockwell Automation’s entire liability and Your exclusive remedy for breach of the Limited Warranty shall be: 1.
FactoryTalk EnergyMetrix Software TERM AND TERMINATION This EULA takes effect upon Your use of the Software and remains effective until terminated for any reason. You may terminate it at any time by destroying all copies of the Software and Documentation in Your possession. It will also automatically terminate if You fail to comply with any term or condition of this EULA.
Appendix • SAMPLES The Software may include samples, plug-ins, UI components and/or reports that are provided as an accommodation to You (“Samples”). These Samples are intended to be used for example purposes or to provide additional complimentary features. The Samples may be contained in the Software, Documentation (electronic or printed) or downloaded from the Rockwell Automation website.
FactoryTalk EnergyMetrix Software MISCELLANEOUS. This EULA shall be governed by the laws of the State of Wisconsin, without regard to any conflict of laws provisions. The United Nations Convention on the International Sale of Goods will not apply.
Appendix • I. RSLogix 5 and 500.
FactoryTalk EnergyMetrix Software Provided You are an authorized licensee of a RSLogix5000 or other Rockwell Automation software product and fully comply with this Agreement and any amendments and addendums, You have been provided with a license to these software tools or utilities under this Agreement on a complimentary basis in “AS IS” condition for Licensee’s internal use without any representation, support or warranty whatsoever.
Appendix • DEFINITION OF ACADEMIC An academic license may be purchased by any accredited institution where the main focus is on educating students and/or providing research. Many commercial organizations also have an academic component that offers training or teaching, such as service companies and hospitals. The organization’s focus cannot be on supporting external systems, such as non-profit / for-profit hospitals, technology institutes, or think tanks.
FactoryTalk EnergyMetrix Software RESEARCH Rockwell Automation encourages the use of Arena software for conducting independent academic research. The Arena academic version can be used for not-for-profit research outside of the classroom setting, where the primary goal of the research is to solve a general problem with the results being publicly shared and published.
Appendix • Outside U.S./Canada Use our Worldwide Locator for local contact information. Internet Rockwell Automation main site - http://www.rockwellautomation.com/ Discover Energy Software - http://discover.rockwellautomation.com/energy FactoryTalk EnergyMetrix page http://www.rockwellautomation.com/rockwellsoftware/assetmgmt/energymetrix/ Rockwell Automation Support - http://www.rockwellautomation.com/support/ Rockwell Automation Knowledgebase http://www.rockwellautomation.
FactoryTalk EnergyMetrix Software Notes: 322
GLOSSARY C Communication, serial: RS232 offers point-to-point serial communication with only one power monitor at a maximum distance of 50 feet. To communicate over distances greater than 50 feet, or to communicate with multiple power monitors via the same serial port, use RS485 serial communication. Using RS485 communication requires either an external RS232-RS485 converter or an internal RS485 serial card installed in the computer.
FactoryTalk EnergyMetrix Software G Group: A named collection of Devices and other Groups. Groups may be nested to any arbitrary level. L Log, event: A data file which contains activity information about the power monitor, including setpoint alarm activity, relay activity, status input activity, power up, and changes to setup parameters. M Menu: A list of programs, files, commands, or other activities that you select by pointing and clicking with the mouse. Menu bar: Located just below the RT title bar.
Glossary • O OPC: OPC (OLE for Process Control), is a consistent, standardized architecture for communicating with plant floor devices. Over forward setpoint: An over forward setpoint becomes active when the monitored parameter exceeds the setpoint high limit in the positive direction, and remains over the limit for longer than the time specified in the Operate Delay setting. When a setpoint becomes active, it causes an action identified by the Action type to occur and logs the occurrence in the event log.
FactoryTalk EnergyMetrix Software S Serial communication: RS232 offers point-to-point serial communication with only one Powermonitor at a maximum distance of 50 feet. To communicate over distances greater than 50 feet, or to communicate with multiple power monitors via the same serial port, use RS485 serial communication. Using RS485 communication requires either an external RS232-RS485 converter or an internal RS485 serial card installed in the computer.
Glossary • Setpoint, under forward: An under forward setpoint becomes active when the monitored parameter falls below the setpoint low limit in the positive direction, and remains below the limit for longer than the time specified in the Operate Delay setting. When a setpoint becomes active, it causes an action identified by the Action type to occur and logs the occurrence in the event log. If the action energizes a relay or sets an alarm bit, the action remains true until the setpoint becomes inactive.
FactoryTalk EnergyMetrix Software V Value type: Value types are used by the reporting and billing functions to aggregate values of a specific type in one or more meters or groups. The default collection of value types represents the most commonly used electrical energy management parameters. Value types may be set up as Consumption or Demand. Consumption value types are treated as accumulated values of energy or process output, for example, real energy net.
INDEX C FactoryTalk EnergyMetrix Manager 7, 10 ChartsPlus 11, 187, 188, 189, 193, 296 3D button 193 .
FactoryTalk EnergyMetrix Software G Groups 18, 25, 50 Delete 53 Domain 18, 25, 50, 114 Global 19, 29, 53 Parent group 50 M Meters 25, 44, 50, 73 DateOffset 138 DayType 122, 132, 136, 138 EndDate 132, 138 EndHour 122, 132, 136, 138 NonWorkingDay 138 PreviousMonth 138 PreviousYear 138 SeasonType 122, 130, 132, 136, 138 StartHour 122, 130, 132, 136, 138 WorkingDay 138 GetData 123 Contribution Factor 80 GetUnit 121, 124 Log rate 50 Lowest 125 Manual meter 75 LowestTimestamp 125 Meter tag 85 NLowest 1
Index • Reports 29, 50, 107, 130 Roll-up server Get roll-up tag values 88 ReportsPlus 12 Efficiency Report 205 Roll-up meter tag 88 Electrical Summary report 207 Roll-up server Meter 78 Load Factor 12, 208 RT 7, 10, 44, 155, 156, 296 MPR Multi-purpose Report 20 Cost Allocation 228 Fiscal Calendar Objects 237, 238, 239, 240, 241 MPR Page Layout 222 MPR script 212 Declarations 212 Functions 120, 121, 212 Main routine 212 Subroutines 212 Multi-Purpose Report Script 20 Sample MPR scripts 20 Visual Basi
FactoryTalk EnergyMetrix Software Notes: 332
Notes:
www.rockwel lautomation.com Power, Control and Information Solutions Headquarters Americas: Rockwell Automation, 1201 South Second Street, Milwaukee, WI 53204-2496 USA, Tel: (1) 414.382.2000, Fax: (1) 414.382.