
Owner's manual

Displays and Graphics
Chapter 8
8-29
2. Set Select Graph. Use t he up and down cursor keys to select the
axes. Then set them by pressing the left or right cursor keys. The
data for the selected axes change each time you press the left or right
cursor key.
A pictorial representation of the selected graph, which is determined
by the selected axes, is displayed on the screen.
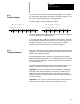
You have three fields that you can adjust. The axes are shown as
horizontal and vertical axes. If you choose a third axis for display, it
appears a s a horizontal axis above the first one. Only linear axes can
be selected for display on the graphics screen.
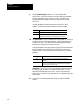
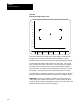
For example:
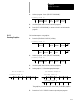
If the X, Y, and Z a xes are selected, this representation appears:
X
Z
Y
Choose a set of axes that best displays the current program’s cutting
path.
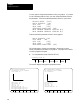
3. Set Rapid Traverse. Use the up and down cursor keys to select the
parameter. Set it by pressing the left or right cursor keys. The value
for the selected parameter changes each time you press the left or
right cursor key.
There are two options available for the rapid traverse parameter:
Choosing: Causesmonochrome: Causes color:
On rapid movestobe drawn with a
dashedline andothermoves to
be drawn witha solid line.
rapid moves arealwaysinred,
unlesstherapidmoves overwrite
greenfeedlines. Ifthisis the
case,the controlusesyellowfor
the rapid movesthatoverlapthe
greenfeedlines.
Off graphics donotdrawany move
that is made inrapidtraverse. All
other moves are drawn witha
solid line.
graphics donotdrawany move
that is made inrapidtraverse.