
USER-PAK Option

Chapter 7
Creating Custom Runtime Displays
7 – 29
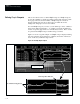
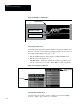
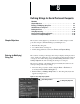
Figure 7.29 Examples of different variable limits
This viewport has a narrower
range between Upper and
Lower limits
This viewport has a wider
range between Upper and
Lower limits, and thus a less
dramatic display of results
Upper limit = 50
Upper limit = 100
Lower limit = 20
Lower limit = 0
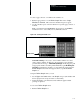
Note these additional considerations when setting Upper and Lower limits:
• The limits you set are for the Graph viewport itself, and therefore
encompass all variables plotted in the viewport. You cannot set Upper
and Lower limits ranges for each variable individually. Therefore, be
sure to accommodate the results of all variables you are plotting when
setting the Upper and Lower limits.
• Results which go beyond the Upper limit are plotted along the top of the
viewport. Results which go beyond the Lower limit are plotted along the
bottom of the viewport.
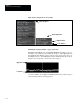
To set either the Upper or Lower limit:
• Pick the Upper or Lower box, as appropriate, on the Define Graph
menu, which causes the calculator pad to appear.
• Use the calculator pad to enter the range limit.
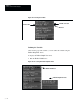
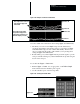
Figure 7.30 Selecting the variable limits
Calculator Pad
Upper box