
USER-PAK Option

Chapter 7
Creating Custom Runtime Displays
7 – 26
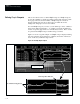
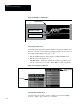
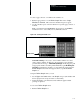
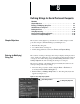
Figure 7.25 Examples of variable styles
Graph Viewport
Example Line Graph
Example Dot Graph
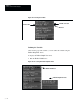
Selecting Variable Color
You further define appearance of the variable by selecting the Color; this is
the color of the line or dot graph created during run time. To select the color
for a graph variable (Figure 7.26, page 7 – 26):
• Pick the Color menu item, which displays a Color Selection menu.
• Pick the box for the desired color.
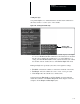
Selecting Clear: If Clear is selected, the variable color will be green,
yellow, or red based on tool status – Pass, Warn, or Fail, respectively.
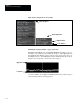
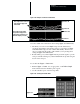
Figure 7.26 Selecting the variable color
Color box
Color Selection
menu
Selecting the Variable Tool
You must select the specific tool whose results are plotted in the Graph
viewport – either a gage, a window, or a formula.