
USER-PAK Option

Chapter 7
Creating Custom Runtime Displays
7 – 23
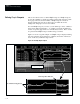
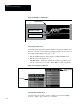
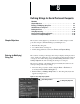
When the Graph viewport is displayed during run mode, the defined
variables are plotted from left to right; plotted variables are either line or dot
style (as defined), and the leading edges of the plotted variables are
emphasized by the “current position indicator,” a vertical line spanning the
viewport. During run mode, the current position indicator moves from left to
right as the variables are plotted from left to right (Note: The plotting of
variables cannot be observed during setup mode).
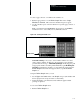
The basic steps for defining a Graph viewport are as follows:
• Complete preliminary steps for defining a viewport. See “Initial Setup:
Selecting and Defining the Viewport,” near the beginning of this chapter,
for more information.
• Select which of three variables (1, 2, or 3) you wish to define, using the
Next or Previous box (located beneath the Define Graph box).
Remember that a variable is something that is tracked by the system, and
can be the result of a gage, a window, or a formula.
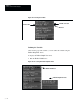
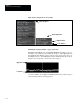
• Using the Define Graph Var. menu, define the variable:
– Enable the variable and set the graphing Style – Line or Dot.
– Select the variable tool – the specific gage, window, or formula
number whose results will be tracked by the graph viewport.
– Set the variable color (the color of the plotting in the Graph viewport
for the respective variable).
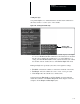
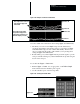
• Using the Define Graph menu, define the Event, or circumstances under
which the graph variable plottings are updated, and set the Upper and
Lower parameters for the range of the Graph viewport.
Selecting the Variable
You can define from one to three variables for the Graph viewport.
To select the variable you wish to define:
• Pick the Next or Previous box (located beneath the Define Variable
box).