
User manual

Choosing Communication
Chapter 5
5-7
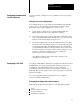
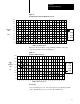
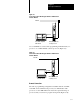
Figure 5.5
Average
Response T
ime for all PLC5 Processors
Number of PLC5 Processors
Response
Time
(Sec)
50 W
100 W
250 W
500 W
+
•
X
W=Words
0.0
0.5
1.0
1.5
2.0
2.5
3.0
3.5
4.0
4.5
5.0
1 2 3 4 5 6 7 8 9 10 11 12 13 14 15 16 17 18 19 20 21 22
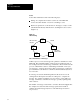
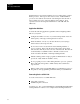
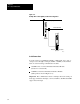
Figure 5.6 shows the effect of a programming terminal on message
response time under various configurations.
Figure 5.6
Response
T
ime Increase (%)
0
5
10
15
20
25
30
35
40
1 2 3 4 5 6 7 8 9 10111213141516171819202122
Number of PLC5 Processors
Response
Time
(%)
Effect
on
%
%
%
%
%
%
%
%
%
50 W
100 W
250 W
500 W
+
•
X
W=Words
Test Setup
One to 22 PLC-5 processors were used with one programming terminal
online. Each PLC-5 processor executes 1K of ladder logic.