
User Manual User guide

Rockwell Automation Publication 1783-UM004E-EN-P - June 2014 119
Manage the Switch via the Device Manager Web Interface Chapter 4
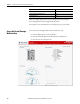
Dashboard Overview
You can use the dashboard to monitor switch status and performance.
The Dashboard window is similar to the Monitor > Trends window. The
Dashboard window displays the instantaneous status while the Trends window
displays the historical status. By using them together, you can gather the detailed
conditions of the switch and its ports. For information about the Trends window,
see
page 170.
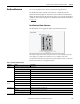
Front Panel and Status Indicators
The Front Panel view is a graphical display of the switch front panels.
The switch components on the front panel view are color-coded by status. The
colors help you to quickly see if a fault or an error condition exists. The
system-level status indicators and port-level status indicators shown on the front
panel view match those on the physical switch.
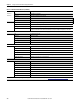
Table 9 - Front Panel Status Indicators
Indicator Status Description
EIP Mod The EIP Mod status indicator shows the status of the switch.
Off Power to the switch is off or is not properly connected.
Solid green The switch is operating properly.
Blinking green The switch is not configured (for example, the switch does not have an IP address configured).
Blinking red The switch has detected a recoverable system fault.
Solid red The switch has detected a non-recoverable system fault.
Blinking green and red The switch is running its power-on self-test (POST).
DC_A
DC_B
Off Power to the switch is off or is not properly connected.
Solid green Power is present on the associated circuit.
Solid red Power is not present on the associated circuit, and the switch is configured for dual-input power.
Alarm Out Off Alarm Out not configured, or the switch is off.
Solid green Alarm Out is configured; no alarm is detected.
Blinking red The switch has detected a major alarm.