
User guide

FACTORYTALK HISTORIAN ME MODULE USER’S GUIDE
196
Web Diagnostics Server
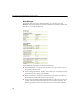
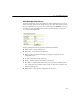
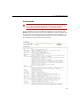
The Web Diagnostics Server page displays the Web Diagnostics Server process
name, CPU usage, memory used, up time, priority, and Nice value. To access the
page, click Firmware in the top navigation bar of the Web Diagnostics interface, and
then click Web Diagnostics Server in the left navigation bar.
The Web Diagnostics Server page lists the following information:
Process Name - the title of the process.
CPU Usage - the percent of CPU utilization.
Memory Used - the amount of memory (in megabytes) utilized by the web
diagnostics server.
Up Time - the amount of CPU time used.
Priority - indicates the precedence order for the process.
Nice Value - a value that indicates the CPU process priority. The default value is
zero. A high Nice value indicates a lower priority for the process. Negative Nice
values are higher priority.