
Owner's manual

10 • USING WEB DIAGNOSTICS
197
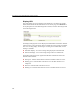
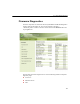
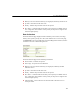
To access the page, click Firmware in the top navigation bar of the Web Diagnostics
interface, and then click Historian Server in the left navigation bar.
This page displays the following information:
Running Subsystem - lists all runnings subsystems.
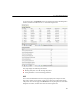
Tuning Parameters - lists the PI tuning parameters.
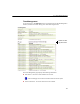
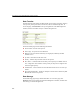
CIP
The Control and Information Protocol (CIP) page displays the CIP process name,
CPU usage, memory used, up time, priority, Nice value, and a restart button for the
CIP process. To access the page, click Firmware in the top navigation bar of the Web
Diagnostics interface, and then click CIP in the left navigation bar.