
User Manual, 400 A Owner's manual

Rockwell Automation Publication 1608M-UM001A-EN-P - September 2013 33
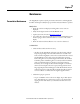
Display Screen Chapter 6
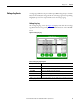
Voltage Sag RMS Voltage
Charts
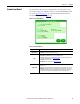
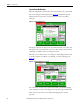
The line and load RMS voltage (L-N) of each phase is recorded for 8 cycles prior
to the start of the voltage sag followed by the first 300 cycles of the voltage sag
(See Figure 22
). Reach this screen by pressing “CHARTS” on the “Voltage Sag
Detail” screen as shown in Figure 21 on page 32
.
Figure 22 - RMS Voltage Charts
Line voltage is shown in red and load voltage is shown in green. By pressing the
check boxes in the right column, you can toggle each data series Off and On as
well as enable y-axis auto-scaling.
Note: 300 cycles = 5.0 seconds at 60 Hz or 6 seconds at 50 Hz.
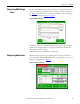
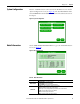
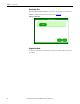
Voltage Sag Notification While the voltage sag is in-progress, a flashing red box in the upper left-hand
corner will display “SAG-IN-PROGRESS.” This box will appear on every screen
until the voltage sag ends. See Figure 23
.
Figure 23 - Voltage Sag Detected