
Owner manual

274 Rockwell Automation Publication GMSI10-UM002D-EN-E - August 2012
Chapter 10 Run Up/Coast Down Application
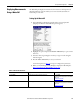
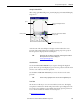
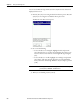
4. When you are finished and ready to display the waterfall plot, press F4
(Display).
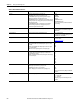
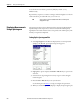
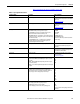
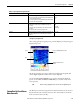
Table 50 - Waterfall Plot Setup Parameters
Parameter Name Description Values/Comments
Z-axis Controls the spacing between the collected spectra.
• RPM- FFTs spaced depending on the RPM at which they were
recorded.
• Timestamp- FFTs spaced depending on the time the data was
recorded.
• Even Spacing- FFTs spaced evenly along the Z-axis.
Options:
RPM
Timestamp
Even Spacing
No. Spectra Controls the number of spectra to display on the waterfall plot. The
spectra are displayed as follows:
• The first spectrum is always displayed.
• The last spectrum is always displayed.
• The other spectra (No. Spectra minus first and last spectrum) are
evenly distributed on the plot.
2…60 spectra
Trace Offset Sets the angle of the Z-axis on the plot. Options:
0 degrees
22.5 degrees
45 degrees
Trace Height Controls the height of the spectra on the plot. Options:
Small
Medium
Large
Disp. Order Controls the order in which to display the spectra.
• Forward- Display spectra from oldest (front of the waterfall) to
newest (rear of the waterfall).
• Reverse- Display spectra from newest (front of the waterfall) to
oldest (rear of the waterfall).
Options:
Forward
Reverse
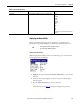
Blanking Eliminates the display of data below a certain level on the Y-axis. This
setting helps clarify the presence of machine orders or structural
frequencies.
0%…25%