
Owner manual

Rockwell Automation Publication GMSI10-UM002D-EN-E - August 2012 271
Run Up/Coast Down Application Chapter 10
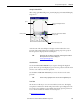
Displaying Measurements
Using a Waterfall
The Waterfall plot displays the vibration level in relation to the frequencies at
which the vibration occurs. It enables you to view several measurements in
relationship to each other.
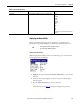
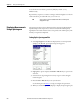
Setting Up the Waterfall
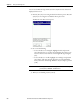
1. Select Waterfall on the RUCD - Display Select screen and press F4
(Display). The RUCD - Waterfall Setup screen appears.
2. Highlight the option and press the RIGHT ARROW key to open a menu
of choices.
3. Select the choice by pressing the arrow keys or type in a value using the
numeric keypad.
4. Press the LEFT ARROW key to save your selection.
Use the descriptions in Ta ble 4 9
to help you configure the parameters.
5. When you are finished, press F4 (Display) to display the Waterfall plot.
Refer to
Displaying the Waterfall Plot on page 273.
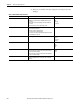
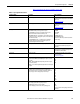
Table 49 - Waterfall Plot Parameters
Parameter Name Description Values/Comments
Start Spd (RPM) Sets the start speed of the recorded data for the plot. 10…3600 RPM
This defaults to the Start Spd value set in the RUCD
Setup screen.
See Table 44 on page 258
.
Stop Spd (RPM) Sets the stop speed of the recorded data for the plot. 10…3600 RPM
This defaults to the Stop Spd value set in the RUCD
Setup screen.
See Table 44 on page 258
.