
Owner manual

Rockwell Automation Publication GMSI10-UM002D-EN-E - August 2012 267
Run Up/Coast Down Application Chapter 10
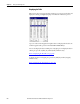
Displaying the Nyquist Plot
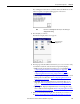
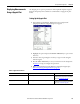
When you are done setting up the plot parameters, you can process the data and
display the Nyquist plot by pressing F4 (Display) on the RUCD - Nyquist Setup
screen.
.
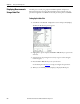
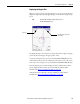
The display shows the selected orders as complex data with zero degrees along the
positive X-axis and 90 degrees along the positive Y-axis.
To sequence through the traces, press the UP and DOWN ARROW keys. The
order number of the current trace is displayed in the top left corner of the screen.
To move the cursor along the trace, press the LEFT and RIGHT ARROW keys.
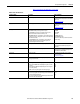
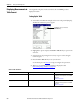
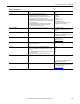
From the Nyquist plot you can also display the data in a Table format or Bode
plot. To display the data in a table, press the 0 (Shift) key and F4 (Table)
simultaneously. Refer to
Displaying the Table on page 270.
To display the data in a Bode plot, press the 0 (Shift) key and F1 (Bode)
simultaneously. Refer to
Displaying the Bode Plot on page 264.
TIP
The larger the .wav file, the longer it takes to process
the data and display the plot.
Speed, Magnitude, and Q Factor at
Cursor Location
Active Trace