
Owner manual

Rockwell Automation Publication GMSI10-UM002D-EN-E - August 2012 265
Run Up/Coast Down Application Chapter 10
Displaying Measurements
Using a Nyquist Plot
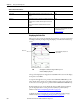
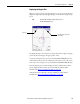
The Nyquist plot is a polar representation of the amplitude and phase angle as a
function of frequency. Three variables are combined into a single plot in polar
format.
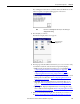
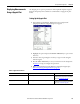
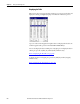
Setting Up the Nyquist Plot
1. Select Nyquist on the RUCD - Display Select screen and press F4
(Display). The RUCD - Nyquist Setup screen appears.
2. Highlight the option and press the RIGHT ARROW key to open a menu
of choices.
3. Select the choice by pressing the arrow keys or type in a value using the
numeric keypad.
4. Press the LEFT ARROW key to save your selection. Use the descriptions
in Table 47
to help you configure the parameters.
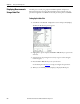
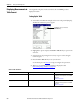
5. When you are finished, press F4 (Display) to display the Nyquist plot.
Refer to
Displaying the Nyquist Plot on page 267.
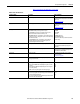
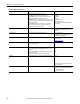
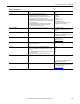
Table 47 - Nyquist Plot Parameters
Parameter Name Description Values/Comments
Start Spd (RPM) Sets the start speed of the recorded data for the plot. 10…3600 RPM
This defaults to the Start Spd value set in the RUCD
Setup screen. See Table 44 on page 258.
Stop Spd (RPM) Sets the stop speed of the recorded data for the plot. 10…3600 RPM
This defaults to the Stop Spd value set in the RUCD
Setup screen. See Table 44 on page 258.