
Owner manual

Rockwell Automation Publication GMSI10-UM002D-EN-E - August 2012 261
Run Up/Coast Down Application Chapter 10
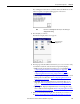
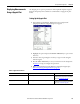
The resulting time waveform is recorded as a Microsoft Windows .wav file
and the Acquisition Completed dialog appears on the screen.
5. Press F4 (OK) to continue.
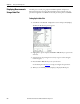
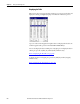
The RUCD - Display Select screen appears.
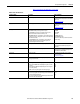
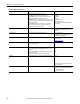
6. The Enpac provides five different formats for you to use to view the newly
recorded time waveform. Select the format and press F4 (Display).
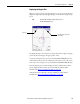
•Bode - Display the magnitude and phase over a varying RPM. Refer
to Displaying Measurements Using a Bode Plot on page 262.
•Nyquist - Display the selected orders as complex data. Refer
to Displaying Measurements Using a Nyquist Plot on page 265.
•Table - Display the magnitude and phase of selected orders at the varied
RPM speeds in a table format. Refer to
Displaying Measurements in
Table Format on page 268.
•Waterfall - Display multiple FFT traces overlaid and offset on one
single plot. Refer to
Displaying Measurements Using a Waterfall on
page 271.
•Spectrogram - Display multiple FFT traces on one single plot, using
color to indicate relative magnitude. Refer to
Displaying Measurements
Using a Spectrogram on page 276.
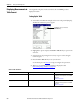
7. When you are finished analyzing the time waveform, you can save it to a
file. Refer to
Saving Run Up/Coast Down Measurements on page 279.
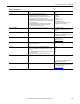
TIP
If an error occurs during data collection, an error message is
displayed in this dialog.
Use the arrow keys to
highlight an icon.