User Manual Run Up Coast Down Extension Module for the Dynamix 2500 Data Collector Catalog Number 1441-DYN25-MRUC
Important User Information Solid-state equipment has operational characteristics differing from those of electromechanical equipment. Safety Guidelines for the Application, Installation and Maintenance of Solid State Controls (publication SGI-1.1 available from your local Rockwell Automation sales office or online at http://www.rockwellautomation.com/literature/) describes some important differences between solid-state equipment and hard-wired electromechanical devices.
Table of Contents Preface Optional Extension Modules. . . . . . . . . . . . . . . . . . . . . . . . . . . . . . . . . . . . . . . . 5 Additional Resources . . . . . . . . . . . . . . . . . . . . . . . . . . . . . . . . . . . . . . . . . . . . . . . 6 Chapter 1 Installing Optional Extension Modules Install an Extension Module . . . . . . . . . . . . . . . . . . . . . . . . . . . . . . . . . . . . . . . . 7 Uninstall Extension Modules. . . . . . . . . . . . . . . . . . . . . . . . . . . . . . . . . . . . .
Table of Contents Notes: 4 Rockwell Automation Publication 1441-UM006A-EN-P - May 2011
Preface This manual covers the Dynamix 2500 data collector Run Up Coast Down (RUCD) extension module. When using the Dynamix 2500 Data Collector Run Up Coast Down Extension Module, you can do the following: • Record and analyze data from intermittent events and transient vibration signals from non-steady state machines. • Analyze a machine’s critical speeds and resonant frequencies.
Preface Additional Resources These documents contain additional information concerning products from Rockwell Automation. Resource Description Dynamix 2500 Data Collector User Manual, publication 1441-UM001 Describes the Dynamix 2500 data collector which provides predictive maintenance by using noise and vibration analysis. Dynamix 2500 Data Collector Bump Test Extension Module User Manual, publication 1441-UM002 Describes how determine natural (or resonant) frequencies of a machine or structure.
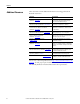
Chapter 1 Installing Optional Extension Modules The data collector uses the Extension Manager to install and uninstall extension modules. These extension modules are licensed and ordered separately from the basic entry level product. Topic Page Install an Extension Module 7 Uninstall Extension Modules 9 Manage Extension Modules 12 Extension Module Battery Status Indicators 13 The installation Secure Digital (SD) cards that you receive work with any Dynamix 2500 data collector.
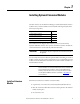
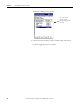
Chapter 1 Installing Optional Extension Modules 4. Apply power to the data collector. 5. From the Main Menu, select Setup Utility and press Enter. 6. Press 0 (Shift) to display the second set of functions. Extension Manager The Extension Manager function remains on the screen for about 3 seconds after releasing 0 (Shift). 7. Press F1 (Extn Mgr). The Extension Manager screen appears showing the current extension module installations. 8. Press 0 (Shift) to display the Install extension function. 9.
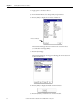
Installing Optional Extension Modules Chapter 1 When the installation is complete, a confirmation prompt appears. 10. Press F4 (OK). The new extension module appears in the list. 11. Press F4 (Esc) to exit the Extension Manager screen. Uninstall Extension Modules Follow these instructions to uninstall an extension module. 1. Press 0 (Shift) from the Setup Utility screen to display the Extension Manager function.
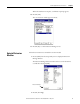
Chapter 1 Installing Optional Extension Modules The Extension Manager screen appears. This screen lists the extension modules currently installed and the on the unit. 3. Select the extension module you want to uninstall and press F3 (Select). F3 (Select) toggles the selection on and off.
Installing Optional Extension Modules Chapter 1 A checkmark appears next to that extension module. 4. Press F1 (Uninstall). A confirmation message appears. 5. Make sure your installation card is inserted into the instrument. IMPORTANT The extension module is uninstalled and the license on the card is released so that the card can be used to install the extension module on another Dynamix 2500 data collector.
Chapter 1 Installing Optional Extension Modules Manage Extension Modules The Dynamix 2500 data collector lets you to hide installed extension modules from the Main Menu. You may need to hide an advanced extension module icon from an inexperienced user, for example, RUCD and FRF. IMPORTANT Once an extension module is hidden, its icon is not represented on the Main Menu or displayed in the Dynamix 2500 data collector About screen.
Installing Optional Extension Modules Chapter 1 3. Select the extension module that you want to hide or show and press F2 (Show/Hide). TIP If you want to show or hide multiple extension modules simultaneously, select each extension module and press F3 (Select). A checkbox appears next to each selected extension module. If you select multiple extension modules and some are hidden while others are shown, F2 (Show/Hide) reflects the status of the selected extension module. 4.
Chapter 1 Installing Optional Extension Modules Notes: 14 Rockwell Automation Publication 1441-UM006A-EN-P - May 2011
Chapter 2 Run Up/Coast Down Extension Module The Run Up/Coast Down (RUCD) extension module is an optional module for the Dynamix 2500 data collector. You install the extension module with the RUCD Secure Digital (SD) card. See Installing Optional Extension Modules on page 7 for installation instructions.
Chapter 2 Run Up/Coast Down Extension Module The application acquires a simultaneous noise or vibration signal and a tachometer signal.
Run Up/Coast Down Extension Module Set Up Run Up/Coast Down Measurements Chapter 2 The first step in the Run Up/Coast Down extension module is to setup how the measurements are taken by the data collector. 1. Select RUCD on the Main Menu and press the Enter. The RUCD screen appears. 2. Select Setup and press Enter to set up the Run Up/Coast Down parameters. The RUCD - Setup screen appears. 3. Select a parameter and press the Right arrow to open a list of values. 4. Select or type the parameter value.
Chapter 2 Run Up/Coast Down Extension Module Use these descriptions to help you configure the parameters in the Run Up/Coast Down Setup screen. Table 2 - Run Up/Coast Down Setup Parameters Parameter Description Values/Comments Transducer Specifies the type of sensor used on Connector A, this is typically Accel (g). Accel ICP (g) (default) The specified sensor type determines available options and engineering units for subsequent setup fields.
Run Up/Coast Down Extension Module Chapter 2 Table 2 - Run Up/Coast Down Setup Parameters Parameter Description Values/Comments Pulses/Rev The number of tachometer signal pulses per revolution of the reference shaft. .1…1000 To acquire a suitable tachometer signal, the tachometer signal must be approximately 1.5 volts peak-to-peak. The adverse effect of excessively short tachometer pulse widths can be addressed by setting the Max No Order to a higher value to increase the sampling rate.
Chapter 2 Run Up/Coast Down Extension Module 3. Attach a transducer to the bearing house. 4. Start the machine or stop the machine as needed. 5. From the RUDC Setup screen press F3 (Start). The RUCD - Taking Data screen appears. Current Speed of Machine Current Overall Vibration Reading Maximum Acquisition Time in the Armed State Remaining Recording Time in the Acquiring State Message Area The Dynamix 2500 data collector begins collecting run up or coast down data based on the parameters you selected.
Run Up/Coast Down Extension Module Chapter 2 The resulting time waveform is recorded as a Microsoft Windows .wav file and the Acquisition Completed dialog appears on the screen. TIP If an error occurs during data collection, a message appears in this dialog box. 6. Press F4 (OK) to continue. The RUCD - Display Select screen appears. The Dynamix 2500 data collector provides five different formats for you to use to view the newly recorded time waveform. 7. Select the format and press F3 (Display).
Chapter 2 Run Up/Coast Down Extension Module Format Description Table Displays the magnitude and phase of selected orders at the varied rpm speeds in a table format. See Displaying Measurements in Table Format on page 28. Waterfall Displays multiple FFT traces overlaid and offset on one single plot. See Displaying Measurements Using a Waterfall on page 31. Spectrogram Displays multiple FFT traces on one single plot, using color to indicate relative magnitude.
Run Up/Coast Down Extension Module Chapter 2 5. When you are finished, press F3 (Display) to display the Bode plot. See Display the Bode Plot on page 24. Table 4 - Bode Plot Parameters Parameter Description Values/Comments Start Spd (RPM) Sets the start speed of the recorded data for the Bode plot. 10…3600 rpm This defaults to the Start Spd value set in the RUCD Setup screen. See Table 2 on page 18. Stop Spd (RPM) Sets the stop speed of the recorded data for the Bode plot.
Chapter 2 Run Up/Coast Down Extension Module Table 4 - Bode Plot Parameters Parameter Description Values/Comments Show Overall Determines whether to display the overall severity as a trace on the Bode plot. Yes (default) No Num Traces Sets the number of traces or order tracks to be displayed on the Bode plot: • The number of traces available is determined by the Show Overall parameter. • Your selection determines the available number of Trace Order parameters.
Run Up/Coast Down Extension Module Chapter 2 • From the Bode plot you can also display the data in a Table format or Nyquist plot. To display the data in a table, press 0 (Shift) and F4 (Table). See Display the Table on page 30 for more information. • To display the data in a Nyquist plot, press 0 (Shift) and F1 (Nyqst). See Display the Nyquist Plot on page 27 for more information.
Chapter 2 Run Up/Coast Down Extension Module See Display the Nyquist Plot on page 27. Table 5 - Nyquist Plot Parameters Parameter Name Description Values/Comments Start Spd (RPM) Sets the start speed of the recorded data for the plot. 10…3600 rpm This defaults to the Start Spd value set in the RUCD Setup screen. See Run Up/Coast Down Setup Parameters on page 18. Stop Spd (RPM) Sets the stop speed of the recorded data for the plot.
Run Up/Coast Down Extension Module Chapter 2 Display the Nyquist Plot When you are done setting up the plot parameters, you can process the data and display the Nyquist plot by pressing F3 (Display) on the RUCD - Nyquist Setup screen. TIP The larger the .wav file, the longer it takes to process the data and display the plot.
Chapter 2 Run Up/Coast Down Extension Module Displaying Measurements in Table Format The magnitude and phase of selected orders at the varied rpm speeds are displayed in a table. Set Up the Table 1. Select Table on the RUCD - Display Select screen and press F3 (Display). The RUCD - Table Setup screen appears. 2. Select a parameter press the Right arrow to open a list of values. 3. Select or type in a parameter value. 4. Press the Left arrow to save your selection.
Run Up/Coast Down Extension Module Chapter 2 Table 6 - Table Parameter Descriptions Parameter Name Description Values/Comments Spacing Controls the spacing between collected spectra: Δ rpm % Δ rpm Δ Time Δ rpm + Δ Time % Δ rpm + Δ Time • Δ rpm is a fixed speed change between spectra. • % Δ rpm is a percentage speed change between spectra. • Δ Time is a fixed time interval between spectra. • Δ rpm + Δ Time is a combination of speed and time interval settings.
Chapter 2 Run Up/Coast Down Extension Module Display the Table When you are done setting up the table parameters, you can process the data and display the table by pressing F4 (Display) on the RUCD - Table Setup screen. Up to two orders of the magnitude and phase data set is displayed in the table: • To scroll through the table, press the Up and Down arrows. • You can also display the data in a Bode plot. To display the data in a Bode plot or Nyquist plot, press 0 (Shift) and F4 (Bode).
Run Up/Coast Down Extension Module Displaying Measurements Using a Waterfall Chapter 2 The Waterfall plot displays the vibration level in relation to the frequencies at which the vibration occurs. It lets you view several measurements in relationship to each other. Set Up the Waterfall 1. Select Waterfall on the RUCD - Display Select screen and press F3 (Display). The RUCD - Waterfall Setup screen appears. 2. Select the option and press the Right arrow to open a list of values. 3.
Chapter 2 Run Up/Coast Down Extension Module Table 7 - Waterfall Plot Parameters Parameter Name Description Values/Comments Spacing Controls the spacing between collected spectra: Δ rpm % Δ rpm Δ Time Δ rpm + Δ Time % Δ rpm + Δ Time • Δ rpm is a fixed speed change between spectra. • % Δ rpm is a percentage speed change between spectra. • Δ Time is a fixed time interval between spectra. • Δ rpm + Δ Time is a combination of speed and time interval settings.
Run Up/Coast Down Extension Module Chapter 2 Table 7 - Waterfall Plot Parameters Parameter Name Description Values/Comments LF Cutoff (EU) Sets a low frequency cutoff filter to remove noise from the analysis. Off The available options are determined by the X-axis selection. 21.6 CPM 66 CPM 120 CPM 600 CPM 4200 CPM .36 Hz 1.
Chapter 2 Run Up/Coast Down Extension Module 4. When you are finished and ready to display the waterfall plot, press F3 (Display). Table 8 - Waterfall Plot Setup Parameters Parameter Name Description Values/Comments Z-axis Controls the spacing between the collected spectra. RPM • RPM- FFTs spaced depending on the rpm at which they were recorded. • Timestamp- FFTs spaced depending on the time the data was recorded. • Even Spacing- FFTs spaced evenly along the Z-axis. No.
Run Up/Coast Down Extension Module Chapter 2 Frequency and Magnitude at Cursor Position Speed Speed, Time, or Data Collection Number of Rear Spectrum Active Spectrum Number and Spacing of Spectra be relative to the active spectrum. Use the Left and Right arrows to move the cursor on the active spectrum. TIP Press P to quickly move the cursor to the next significant peak. Z-axis Zoom The Z-axis zoom lets you to zoom in around the current trace.
Chapter 2 Run Up/Coast Down Extension Module Displaying Measurements Using a Spectrogram The Spectrogram plot is a three-dimensional color intensity plot displaying the amplitude of spectral components as a function of both time and frequency. Typically the horizontal and vertical axes correspond to time and frequency. The intensity corresponds to amplitude. Set Up the Spectrogram Plot Follow these instructions to setup the plot. 1.
Run Up/Coast Down Extension Module Chapter 2 Table 9 - Spectrogram Plot Parameter Descriptions Parameter Name Description Values/Comments Start Spd (RPM) Sets the start speed of the recorded data for the plot. 10…3600 rpm This defaults to the Start Spd value set in the RUCD Setup screen. See Run Up/Coast Down Setup Parameters on page 18. Stop Spd (RPM) Sets the stop speed of the recorded data for the plot. 10…3600 rpm This defaults to the Stop Spd value set in the RUCD Setup screen.
Chapter 2 Run Up/Coast Down Extension Module Table 9 - Spectrogram Plot Parameter Descriptions Parameter Name Freq. Range (EU) Description Values/Comments The maximum frequency for the measurement. 10…2000 Hz The frequency range is determined by the X-axis parameter. 600…120000 CPM .001…166 Orders LF Cutoff (EU) Sets a low frequency cutoff filter to remove noise from the analysis. Off The available options are determined by your X-axis selection. 21.6 CPM 66 CPM 120 CPM 600 CPM 4200 CPM .
Run Up/Coast Down Extension Module Chapter 2 Table 10 - Spectrogram Plot Setup Parameters Parameter Name Description Values/Comments Y-axis Sets the Y-axis scaling on the spectrogram plot: Linear • Linear - The plot grid centers are linearly spaced in Y between the centers of the first and last grid. • Log - The plot grid centers are logarithmically spaced in Y between the centers of the first and last grid.
Chapter 2 Run Up/Coast Down Extension Module Save Run Up/Coast Down Measurements The Run Up/Coast Down setup parameters and measurements can be saved to a file which you can recall at a later time. The collected data is saved in the form of a time waveform (.wav file). You can save the RUCD setup and measurement anytime the Save function is displayed on the screen. Follow these steps to save a RUCD measurement. 1.
Run Up/Coast Down Extension Module Recall a Setup Chapter 2 You can recall a previously saved setup and use it to collect another measurement. The setup may have been saved only as a setup, or may have been saved with the recorded data. See Save Run Up/Coast Down Measurements on page 40 for more information. Follow these steps to recall a setup. 1. Select RUCD on the Main Menu and press Enter. The RUCD screen appears. 2. Select Recall and press Enter. The RUCD - Load Setup screen appears.
Chapter 2 Run Up/Coast Down Extension Module 3. Select the filename that you want recall and press F3 (Open). The RUCD - Setup screen appears. You can edit the settings or start collecting data: • For information on editing the settings, see Set Up Run Up/Coast Down Measurements on page 17. • For information on collecting RUCD measurements, see Collect Run Up/Coast Down Measurements on page 19.
Run Up/Coast Down Extension Module Review Run Up/Coast Down Measurements Chapter 2 You can review previously saved RUCD measurements with the Dynamix 2500 data collector. The instrument saves the recorded data in the form of a time waveform (.wav file). Follow these steps to review an RUCD measurement. 1. Select RUCD on the Main Menu and press Enter. The RUCD screen appears. 2. Select Review Data and press Enter. The RUCD - Review Data screen appears. 3.
Chapter 2 Run Up/Coast Down Extension Module The RUCD - WAV Setup screen lets you to setup the .wav file parameters. TIP The instrument reads the .wav file to determine the maximum speed present. If the number of pulses per revolution is not equal to 1, enter the correct value before processing. 4. Select the parameter and press the Right arrow to open a list of values. 5. Select or type in a parameter value. 6. Press the Left arrow to save your selection.
Run Up/Coast Down Extension Module Chapter 2 Screen Capturing Screens can be saved as a bitmap (.bmp) image to internal memory or to the Secure Digital (SD) card. Press 0 (Shift) and 7 and follow the instructions. Delete Run Up/Coast Down Files You can delete a RUCD measurement or setup from the Dynamix 2500 data collector. Follow these steps to delete a file. 1. Select RUCD on the Main Menu and press Enter. The RUCD screen appears. 2.
Chapter 2 Run Up/Coast Down Extension Module 4. Press 0 (Shift) and F4 (Delete) to delete the selected files. 5. Press F2 (Yes) to delete.
Index B battery status icons 13 battery status icons 13 Blanking 34, 39 Bode plot 22 Bode plot parameters Detection 23 Display Units 23 LF Cutoff 23 Num Traces 24 Show Overall 24 Spacing 23 Speed Interval 23 Start Spd 23 Stop Spd 23 Time Interval 23 Trace Order 24 Y-axis 23 C collecting data run up/coast down measurements 17 configure bode plot parameters 23 nyquist plot parameters 26 run up/coast down parameters 18 spectrogram plot parameters 37, 39 table parameters 28 waterfall plot parameters 31, 34 WAV
Index reviewing data 43 save measurement 40 save setup 40 setting up 17 Setup screen 22 Spectrogram Disp. Setup screen 38 Spectrogram plot 36 Spectrogram plot screen 39 Spectrogram Setup screen 36 Table screen 30 Table Setup screen 28 Taking Data screen 20 Waterfall Disp.
Rockwell Automation Support Rockwell Automation provides technical information on the Web to assist you in using its products. At http://www.rockwellautomation.com/support/, you can find technical manuals, a knowledge base of FAQs, technical and application notes, sample code and links to software service packs, and a MySupport feature that you can customize to make the best use of these tools.