
Manual

86 Rockwell Automation Publication 1426-UM001F-EN-P - November 2013
Chapter 5 Power Quality Monitoring
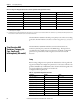
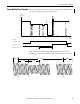
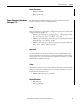
Waveform B represents the third sag, which occurs after the first waveform
recording reached its maximum duration and ended.
Waveform C represents the swell following the interruption.
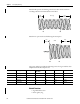
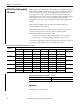
The power quality log includes the following events. The log records have been
simplified to make the example clearer.
Related Functions
• Sag and Swell detection
• Power Quality Log
Post
Event
Pre
Event
80% Sag
t5
t6
Pre
Event
Post
Event
Swell
t8 t9
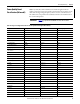
Record ID Event Type Time Stamp Waveform
Timestamp
Event Duration Min or Max Trip Point
1 Voltage Sag t1 t1 60,000.0 408.0 90.00%
2 Voltage Sag t2 t1 133.3 369.6 80.00%
3Undervoltaget100090.00%
4 Voltage Sag t5 t5 200.0 369.6 80.00%
5 Voltage Swell t8 T8 133.3 542.4 110.00%