
Manual

338 Rockwell Automation Publication 1426-UM001F-EN-P - November 2013
Appendix A PowerMonitor 5000 Unit Data Tables
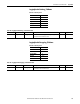
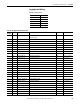
LoggingResults.LoadFactor.Log
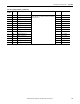
Table 147 - Table Properties
CIP Instance Number 853
PCCC File Number F62
No. of Elements 40
Length in Words 80
Data Type Real
Data Access Read Only
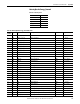
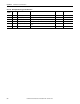
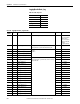
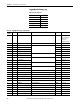
Table 148 - LoggingResults.LoadFactor.Log Data Table
Element
Number
Type Tag Name Description Units Range
0 Real LoadFactor_Record_Number The record number of this data. 1…13
1 Real LoadFactor_End_Date The date that this record was stored. YYMMDD 0…999999
2 Real LoadFactor_Elapsed_Time Amount of time (in hours) that has elapsed since the last clear of the peak and
average values. Updated at the end of each demand interval.
Hr 0.000…
9,999,999
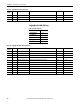
3 Real Peak_Demand _kW The largest magnitude demand for kwatts that occurred over all of the
demand intervals since the last clear command or auto-clear day.
kWh ±0.000… 9,999,999
4 Real Average_Demand_kW A running average of demand for kwatts from the end of each demand period
since the last clear command or auto-clear day.
kWh ±0.000… 9,999,999
5 Real LoadFactor_kW Average Demand kW/Peak Demand kW. This is a demand management
metric that indicates how ‘spiky’ (or ‘level’) a load is over a period of time
(usually 1 month). A value approaching 100% indicates a constant load.
% 0…100 %
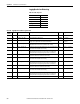
6 Real Peak_Demand_kVAR The largest magnitude demand for kVAR that occurred over all of the demand
intervals since the last clear command or auto-clear day.
kVAR ±0.000… 9,999,999
7 Real Average_Demand_kVAR A running average of demand for kVAR from the end of each demand period
since the last clear command or auto-clear day.
kVAR ±0.000… 9,999,999
8 Real LoadFactor_kVAR Average Demand kVAR/Peak Demand kVAR. This is a demand management
metric that indicates how ‘spiky’ (or ‘level’) a load is over a period of time
(usually 1 month). A value approaching 100% indicates a constant load.
% 0…100 %
9 Real Peak_Demand_kVA The largest magnitude demand for kVA that occurred over all of the demand
intervals since the last clear command or auto-clear day.
kVA 0.000… 9,999,999
10 Real Average_Demand_kVA A running average of demand for kVA from the end of each demand period
since the last clear command or auto-clear day.
kVA 0.000… 9,999,999
11 Real LoadFactor_kVA Average Demand kVA / Peak Demand kVA. This is a demand management
metric that indicates how ‘spiky’ (or ‘level’) a load is over a period of time
(usually 1 month). A value approaching 100% indicates a constant load.
% 0…100 %
12…39 Real Resvd Reserved 0