
Manual


40 Rockwell Automation Publication 1425-UM001A-EN-P - January 2012
Chapter 3 Software Interface
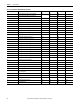
Table 2 1 lists apparent energy raw values (one phase/sum of phases) at varying
percent of nominal phase currents with nominal voltage 240V or 480V for SP2
model.
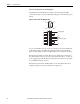
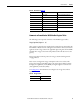
Maximum Current (register 43…45)
The rms current is averaged over 10 cycles (200 mS in a 50 Hz system, 167 ms in
a 60 Hz system). The maximum average current in each phase, measured during
the recording interval, is kept in registers 43…45.
Minimum Voltage (register 46…48)
The rms voltage for each phase is averaged over 10 cycles. The minimum voltage
value measured during the recording interval is kept in registers 46…48.
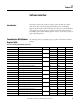
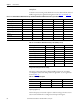
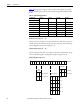
Model Configuration (register 49)
Table 21 - Apparent Energy Raw Values
Load Current 25% Ipn 50% Ipn 100% Ipn 120% Ipn
Interval Time (min)
5 1600 / 4800 3200 / 9600 6400 / 19,200 7680 /23,040
6 1920 / 5760 3840 / 11,520 7680 / 23,040 9216 /27,648
10 3200 / 9600 6400 / 19,200 12,800 / 38,400 15,360 / 46,080
12 3840 / 11,520 7680 / 23,040 15,360 / 46,080 18,432 / 55,296
15 4800 / 14,400 9600 / 28,800 19,200 / 57,600 23,040 / 69,120
20 6400 / 19,200 12,800 / 38,400 25,600 / 76,800 30,720 / 92,160
30 9600 / 28,800 19,200 / 57,600 38,400 / 115,200 46,080 / 138,240
15 14 13 12 11 10 09 08 07 06 05 04 03 02 01 00
000
111
Connection
Diagram
Voltage
Range
Not Used
Reserved
100 A
200 A
500 A
1000 A
2000 A
Rated Current
300V Maximum
520V Maximum
Bit Number
3-wire Delta
4-wire Wye
01 00
01 01
01 10
10 00
10 10
00
01