
Manual


38 Rockwell Automation Publication 1425-UM001A-EN-P - January 2012
Chapter 3 Software Interface
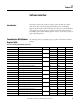
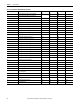
Scaling Factors
To obtain correct metering results, divide the raw values obtained from the listed
Modbus registers by the applicable scaling factor from Ta b l e 17
and Ta b l e 1 8.
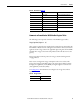
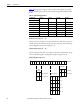
Energy and Recording Interval Time Stamps
The energy counter time stamp, read from Modbus registers 24…26 and the
recording interval data time stamp, read from registers 28…29, are organized as
shown in Tab l e 19
.
Frequency (register 27)
The line frequency is measured on phase 1 of the line voltage. The most recent
value measured within the recording interval is kept in this register.
Table 17 - For All PowerMonitor W250 Models Except -480 Models with External 24V DC Control Power (up to 300V AC rms)
Current Range 100 A 200 A 500 A 1000 A 2000 A
Real Energy Wh [Intvl] 3.2 1.6 0.64 0.32 0.16
Real Energy Wh [Counter] 0.4 0.2 0.08 0.04 0.02
Reactive Energy VARh [Intvl] 3.2 1.6 0.64 0.32 0.16
Reactive Energy VARh [Counter] 0.4 0.2 0.08 0.04 0.02
Apparent Energy VAh [Intvl] 3.2 1.6 0.64 0.32 0.16
Apparent Energy VAh [Counter] 0.4 0.2 0.08 0.04 0.02
Volts rms 25 25 25 25 25
Amperes rms 60 30 12 6 3
Frequency, Hz 16 16 16 16 16
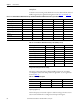
Table 18 - For PowerMonitor W250 Models Ending in -480 (24V DC powered)
Current Range 100 A 500 A 2000 A
Real Energy Wh (Interval) 1.6 0.32 0.08
Real Energy Wh (Counter) 0.2 0.04 0.01
Reactive Energy VARh Interval 1.6 0.32 0.08
Reactive Energy VARh (Counter) 0.2 0.04 0.01
Apparent Energy VAh (Interval) 1.6 0.32 0.08
Apparent Energy VAh (Counter) 0.2 0.04 0.01
Voltage, rms 12 12 12
Amperes, rms 60 12 3
Frequency, Hz 16 16 16
Table 19 - Time Stamp Data Syntax
Register High Byte Low Byte
24 28 Minute Second
25 29 Day Hour
26 30 Year Month